Tune and Visualize Your Model with Dashboard Blocks
The blocks in the Dashboard library help you control and visualize your model during
simulation and while the simulation is paused. This example uses the Model a Fault-Tolerant Fuel Control System example model
sldemo_fuelsys to showcase the control and visualization capabilities of
Dashboard blocks. To open the model, use this command:
openExample('simulink_automotive/ModelingAFaultTolerantFuelControlSystemExample')Note
Dashboard blocks cannot connect to signals inside referenced models or subsystems.
Explore Connections Within the Model
The Dashboard subsystem contains blocks for controlling and visualizing signals in the Fault-Tolerant Fuel Control System model. Explore the connections between the signals and Dashboard blocks. Click either a signal or a Dashboard block to highlight the connections.
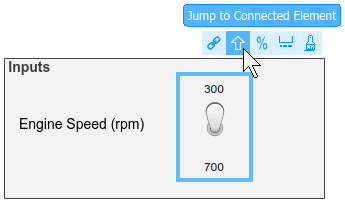
From the Dashboard subsystem, click the Toggle Switch in the Fuel panel. Hover the mouse over the ellipsis above the block and then click the arrow above it to jump to the connected block or signal.

From the top level of the model, click the air_fuel_ratio signal and
see the Dashboard subsystem, Quarter Gauge, and Half
Gauge highlighted.

Simulate Changing Model States
In the Dashboard subsystem, switches provide control over the state of the throttle
angle, engine speed, EGO, and MAP signals. For each sensor signal, the switch toggles
between normal and fail, allowing you to simulate the
system response to each single-point failure. Clicking any one of these switches before
simulation, during simulation, or while a simulation is paused changes the state in the
model.
Run the simulation and observe the control system response to each single-point failure.
Start the simulation.
As the simulation runs, click one of the switches to simulate a component failure.
Observe the changes in the
fuelandair_fuel_ratiosignals in the Dashboard Scope and Gauge blocks when you flip each switch.Stop the simulation when you are finished.

View Signal Data
Dashboard blocks allow you to view signal data using gauges, lamps, and dashboard scopes. In this example, the Dashboard blocks provide visual feedback about the fuel input and air-to-fuel ratio during simulation, after simulation, and while a simulation is paused.
To capture different types of information and more effectively visualize a signal,
connect multiple Dashboard blocks to a single signal. For example, you can visualize the
air_fuel_ratio signal using the Gauge, Quarter Gauge, and Dashboard Scope blocks.

Use the Quarter Gauge block, labeled Normal Range in the example, to see
small fluctuations in the instantaneous air_fuel_ratio signal while its
value lies within the normal operational range. The Gauge block, labeled Full
Range, allows you to see the behavior of the instantaneous air_fuel_ratio
signal outside of the normal range. The Dashboard Scope block shows the
variations of the air_fuel_ratio signal over time.
Tune Parameters During Simulation
Dashboard blocks allow you to tune parameters in your model during a simulation. To explore the tuning capability within the fuel system model, replace the engine speed Toggle Switch block with a Knob:
Delete the engine speed Toggle Switch.
Add a Knob block from the Dashboard library.
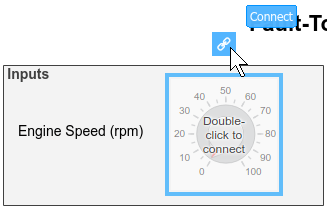
Click the Connect button that appears when you pause on the Knob block. When you click the Connect button, the Simulink® Editor enters connect mode, which facilitates connecting Dashboard blocks to signals and parameters in your model.

Navigate to the top level of the model and select the Engine Speed block. The Engine Speed block is a Constant block whose Constant value parameter you can tune with the Knob block.
When you select the Engine Speed block, the names of tunable parameters associated with the block appear in a table.

Select the option button next to
engine_speedin the table. Then, to exit connect mode, click the Exit button in the upper-right of the model canvas.
Now that the Knob block is connected to the
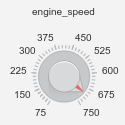
engine_speed parameter, you can set the tick interval and range to
values that make sense for the simulation. Double-click the Knob block to
access the block parameters. In this example, set Minimum to
75, Maximum to 750, and
Tick Interval to 75. Then, click
OK.

Simulate the model and tune the engine_speed parameter using the
Knob.
Start the simulation.
As the simulation runs, drag the pointer on the Knob to adjust the value of
engine_speed.Notice as you use the Knob to adjust the value of
engine_speed, theair_fuel_ratiovalue displayed on the Gauge blocks and in the Dashboard Scope block changes.Stop the simulation when you have finished tuning the parameter.
