View and Analyze Simulation Results
During simulation, you can tune parameter values and view simulation results using one or more tools:
Scope blocks and scope viewers — Quickly connect and visualize data for prototyping and debugging.
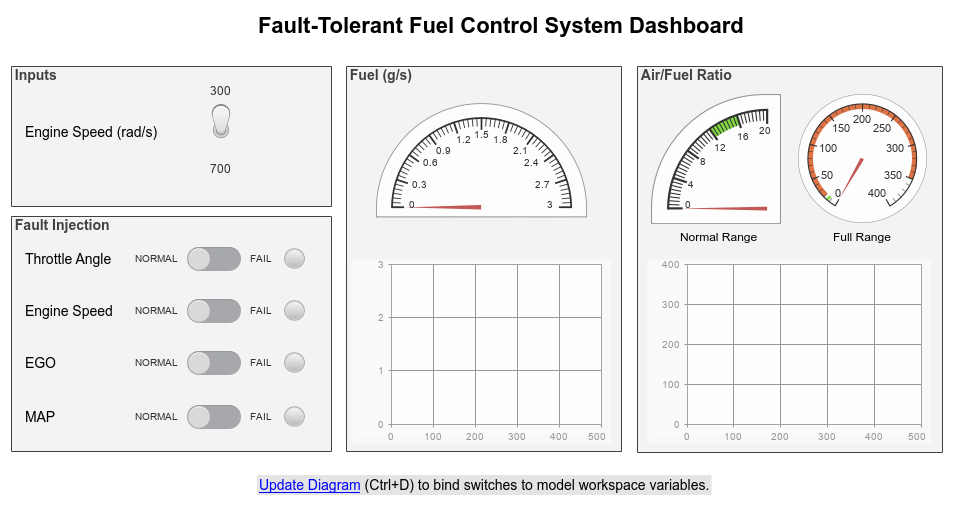
Dashboard blocks — View and monitor instantaneous signal values on dashboard displays, such as gauges and lamps.
Simulation Data Inspector — View many signals together on visualizations such as sparklines, time plots, XY plots, and maps.
Record block — Connect and view signals you can log to the workspace, to a file, or to the workspace and a file.
For complete information about viewing simulation data, see Decide How to Visualize Simulation Data.
After simulation, analyze the results.
Inspect signal values using cursors and scope measurements.
Import data from other sources into the Simulation Data Inspector to analyze alongside simulation data.
Compare signals or runs to analyze model behavior or data from a parameter sweep.
Save and share the simulation data and analysis results.
Save or export simulation data to a MAT file or a Microsoft® Excel® file.
Save data and visualization settings together as a Simulation Data Inspector session.
Generate an interactive report of comparison results.
Categories
- Control Simulations with Interactive Displays
Build dashboard for model, interactively tune parameter values, and monitor signal values during simulation
- View Data During Simulation
View data during simulation using Scope blocks, the Record block, or the Simulation Data Inspector
- Analyze Simulation Results
Inspect data using cursors and custom visualizations, replay simulation results, compare simulation data
- Save Simulation and Analysis Results
Save and share logged simulation data and analysis results in one or more file formats


