Analyze Performance of Code Generated for Deep Learning Networks
This example shows how to analyze and optimize the performance of generated CUDA® code for deep learning networks by using the gpuPerformanceAnalyzer function.
The gpuPerformanceAnalyzer function generates code and collects metrics on CPU and GPU activities in the generated code. The function generates a report that contains a chronological timeline plot that you can use to visualize, identify, and mitigate performance bottlenecks in the generated CUDA code.
This example generates the performance analysis report for a function that uses a deep learning variational autoencoder (VAE) to generate digit images. For more information, see Generate Digit Images on NVIDIA GPU Using Variational Autoencoder.
Third-Party Prerequisites
CUDA-enabled NVIDIA® GPU.
NVIDIA CUDA toolkit and driver. For information on the supported versions of the compilers and libraries, see Third-Party Hardware.
Environment variables for the compilers and libraries. For setting up the environment variables, see Setting Up the Prerequisite Products.
Permissions to access GPU performance counters. From CUDA toolkit v10.1, NVIDIA restricts access to performance counters to only admin users. To enable GPU performance counters to for all users, see Permission issue with Performance Counters (NVIDIA).
Verify GPU Environment
To verify that the compilers and libraries for this example are set up correctly, use the coder.checkGpuInstall function.
envCfg = coder.gpuEnvConfig("host");
envCfg.DeepLibTarget = "cudnn";
envCfg.DeepCodegen = 1;
envCfg.Quiet = 1;
coder.checkGpuInstall(envCfg);
When the Quiet property of the coder.gpuEnvConfig object is set to true, the coder.checkGpuInstall function returns only warning or error messages.
Analyze the Pretrained Variational Autoencoder Network
Autoencoders have two parts: the encoder and the decoder. The encoder takes an image input and outputs a compressed representation. The decoder takes this compressed representation, decodes it, and recreates the original image.
VAEs differ from regular autoencoders in that they do not use the encoding-decoding process to reconstruct an input. Instead, they impose a probability distribution on the latent space, and learn the distribution so that the distribution of outputs from the decoder matches that of the observed data. Then, they sample from this distribution to generate new data.
This example uses the decoder network trained in the Train Variational Autoencoder (VAE) to Generate Images (Deep Learning Toolbox) example. The encoder outputs a compressed representation that is a vector of size latent_dim. In this example, the value of latent_dim is equal to 20.
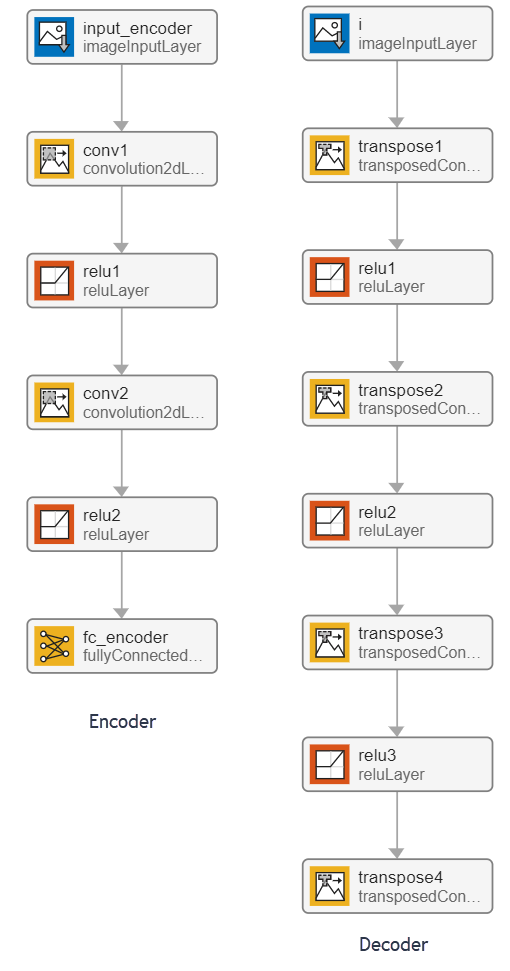
Examine the Entry-Point Function
The generateVAE entry-point function loads the dlnetwork object from the trainedDecoderVAENet MAT-file into a persistent variable and reuses the persistent object during subsequent prediction calls. It initializes a dlarray object that contains 25 randomly generated encodings, passes them through the decoder network, and extracts the numeric data of the generated image from the deep learning array object.
type("generateVAE.m")function generatedImage = generateVAE(decoderNetFileName,latentDim,Environment) %#codegen
% Copyright 2020-2021 The bat365, Inc.
persistent decoderNet;
if isempty(decoderNet)
decoderNet = coder.loadDeepLearningNetwork(decoderNetFileName);
end
% Generate random noise
randomNoise = dlarray(randn(1,1,latentDim,25,'single'),'SSCB');
if coder.target('MATLAB') && strcmp(Environment,'gpu')
randomNoise = gpuArray(randomNoise);
end
% Generate new image from noise
generatedImage = sigmoid(predict(decoderNet,randomNoise));
% Extract numeric data from dlarray
generatedImage = extractdata(generatedImage);
end
Generate GPU Performance Analyzer Report
To analyze the performance of the generated code, use the gpuPerformanceAnalyzer function. First, create a code configuration object with a dynamic library build type by using the dll input argument. Enable the option to create a coder.EmbeddedCodeConfig configuration object.
cfg = coder.gpuConfig("dll","ecoder",true);
Use the coder.DeepLearningConfig function to create a CuDNN deep learning configuration object and assign it to the DeepLearningConfig property of the GPU code configuration object.
cfg.TargetLang = "C++";
cfg.GpuConfig.EnableMemoryManager = true;
cfg.DeepLearningConfig = coder.DeepLearningConfig("cudnn");
Run gpuPerformanceAnalyzer with the default iteration count of 2. The GPU Performance Analyzer collects performance data for both iterations and the entire profiling session.
latentDim = 20;
Env = "gpu";
matfile = "trainedDecoderVAENet.mat";
inputs  = {coder.Constant(matfile), coder.Constant(latentDim), coder.Constant(Env)};
designFileName = "generateVAE";

gpuPerformanceAnalyzer(designFileName, inputs, ...
    "Config", cfg, "NumIterations", 2);
### Starting GPU code generation
Code generation successful: View report

### GPU code generation finished
### Starting application profiling
### Starting SIL execution for 'generateVAE'
    To terminate execution: clear generateVAE_sil
### Application stopped
### Stopping SIL execution for 'generateVAE'
### Application profiling finished
### Starting profiling data processing
### Profiling data processing finished
### Showing profiling data
Generate Performance Analyzer Report Using codegen
You can use the -gpuprofile option of the codegen command to enable GPU profiling and create the GPU performance analyzer report. For example,
codegen -config cfg -gpuprofile generateVAE.m -args inputs
When code generation completes, the software generates a generateVAE_sil executable. This is a software-in-the-loop (SIL) executable that measures the CPU and GPU activities in the generated code. Run the SIL executable.
generateVAE_sil(matFile,latentDim,Env);
Click the clear generateVAE_sil link in the MATLAB® Command Window. The GPU performance analyzer report is available as a link in the Command Window after terminating the SIL executable. For example,
### Application stopped
### Stopping SIL execution for 'fog_rectification'
### Starting profiling data processing
### Profiling data processing finished
    Open GPU Performance Analyzer report: open('/home/test/gpucoder-ex87489778/codegen/dll/fog_rectification/html/gpuProfiler.mldatx')
GPU Performance Analyzer
The GPU performance analyzer report lists GPU and CPU activities, events, and performance metrics in a chronological timeline plot that you can use to visualize, identify, and address performance bottlenecks in the generated CUDA code.
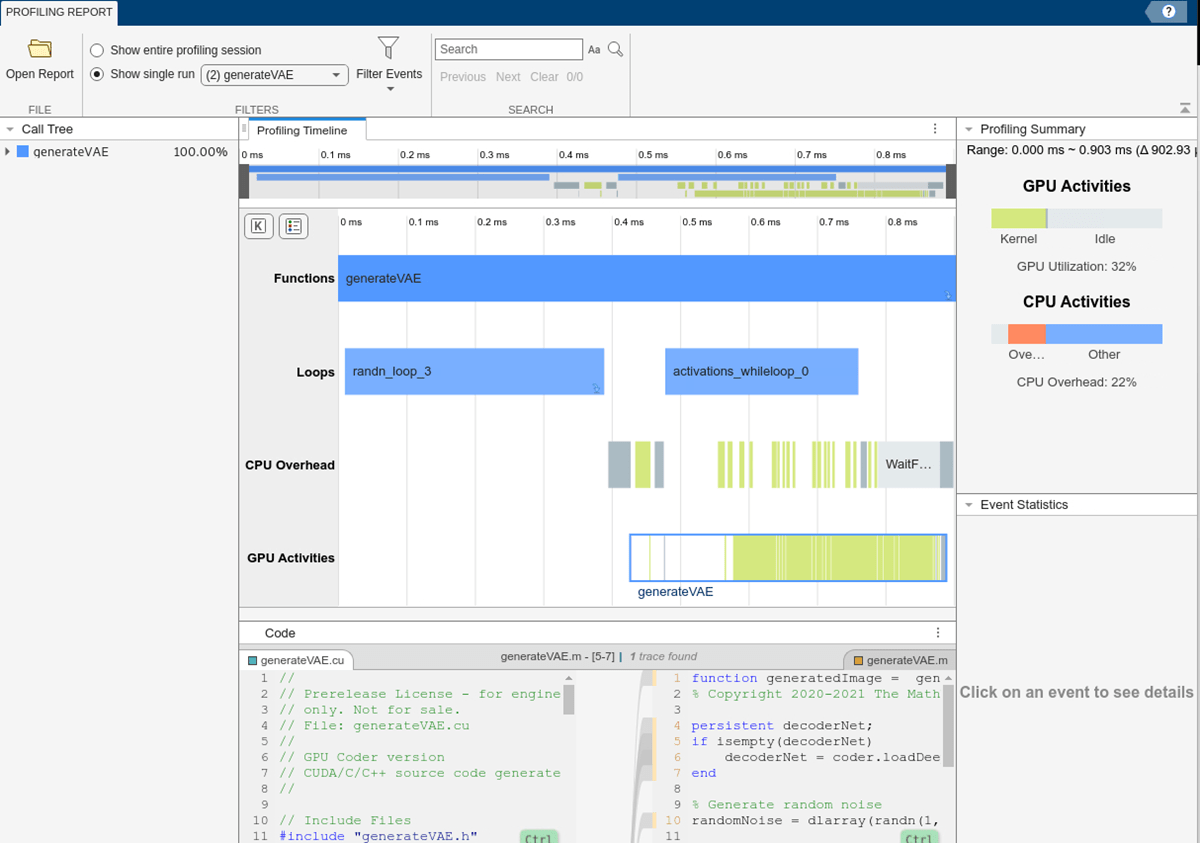
These numbers are representative. The actual values depend on your hardware setup. The profiling in this example was performed using MATLAB® R2024b on a machine with a 12 core, 3.6GHz Intel® Xeon® CPU, and an NVIDIA Quadro RTX 6000 GPU.
Profiling Timeline
The profiling timeline shows the complete trace of all events that have a runtime higher than the threshold value. This image shows a snippet of the profiling trace when the threshold value is set to 0.0 ms.
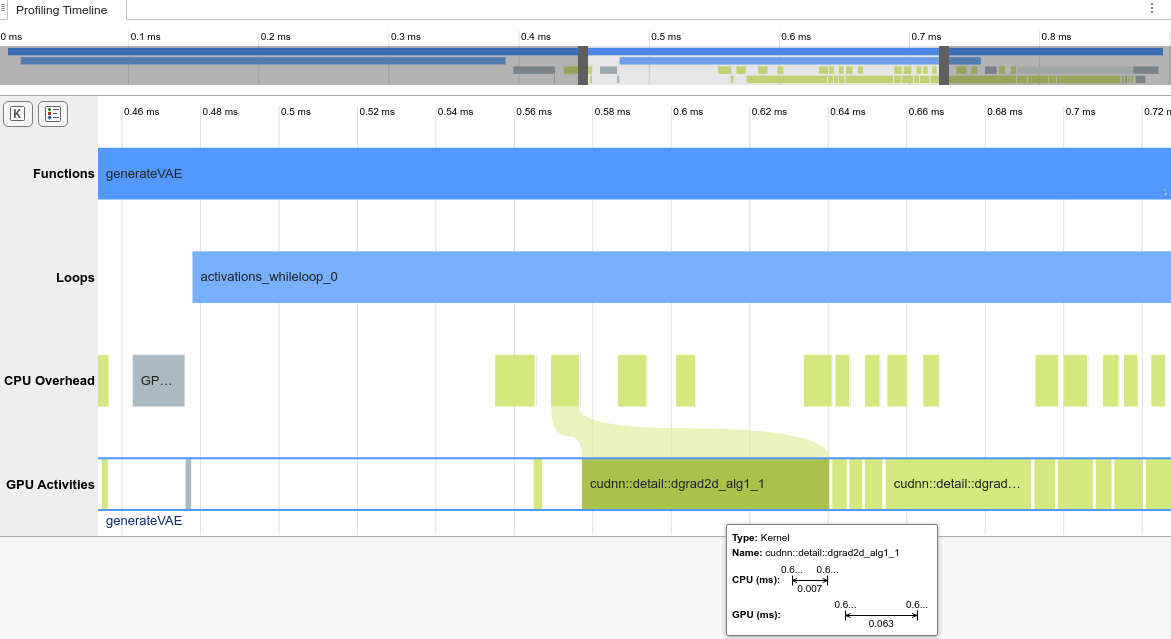
You can use the mouse wheel or the equivalent touchpad option to control the zoom level of the timeline. Alternatively, you can use the timeline summary at the top of the panel to control the zoom level and navigate the timeline plot.
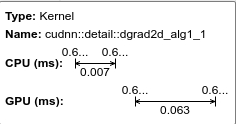
The tooltips on each event indicate the start time, end time, and duration of the selected event on the CPU and the GPU. The tooltips also indicate the time elapsed between the kernel launch on the CPU and the actual execution of the kernel on the GPU.
Right-click an event to open the context menu and add a trace between the CPU and corresponding GPU events. You can also use the context menu to view the generated CUDA code that corresponds to an event on the code pane.
Event Statistics
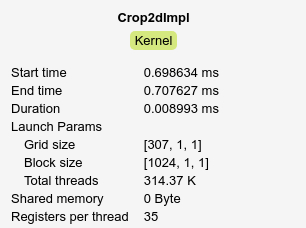
The Event Statistics pane shows additional information for the selected event. For example, selecting the Crop2dImpl kernel shows statistics such as the start time, end time, duration, launch parameters, shared memory, and registers per thread of Crop2dImpl.
Profiling Summary
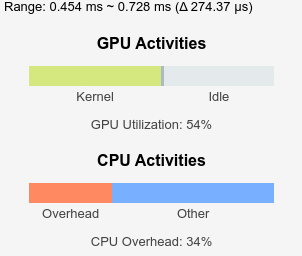
The Profiling Summary pane includes bar charts that provide an overview of the GPU and CPU activities. The bar chart changes according to the zoom level of the profiling timeline. This image shows a snippet of the profiling summary. Within the region selected on the timeline, it shows that the GPU utilization is 54%.
Trace Code
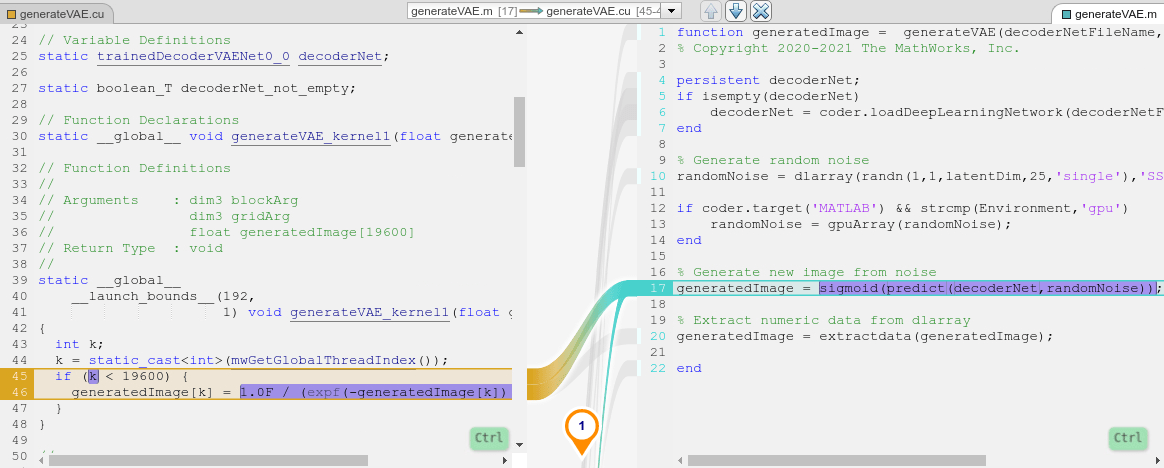
You can use the Code pane to trace from the MATLAB® code to the CUDA code or from the CUDA code to the MATLAB code. Traceable code is blue on the side that you are tracing from and orange on the side that you are tracing to. When you point to the traceable code, the pane highlights the code in purple and traces the corresponding code on the other side. When you select a code section, the pane highlights the code in yellow. The code remains selected until you press Esc or select different code. To change the side that you are tracing from, select code on the other side.
Call Tree
This section lists the GPU events called from the CPU. Each event in the call tree lists the execution times as percentages of the caller function. This metric can help you to identify performance bottlenecks in the generated code. You can also navigate to specific events on the profiling timeline by clicking on the corresponding events in the call tree.
Filters
This section provides filtering options for the report. Select Show entire profiling session to view profiling results for the entire application, including initialize and terminate. Alternatively, select Show single run to view results from an individual run of the design function.
Under Filter Events, you can specify:
Event Threshold — Skip events shorter than the given threshold.
Memory Allocation/Free — Show GPU device memory allocation and deallocation related events on the CPU activities bar.
Memory Transfers — Show host-to-device and device-to-host memory transfers.
Kernels — Show CPU kernel launches and GPU kernel activities.
Others — Show other GPU related events such as synchronization and waiting for GPU.
See Also
Functions
Objects
Related Topics
- GPU Programming Paradigm
- Generate Code by Using the GPU Coder App
- Generate Code Using the Command Line Interface
- Code Generation for Deep Learning Networks by Using cuDNN
- Code Generation for Deep Learning Networks by Using TensorRT
- Analyze Performance of Generated CUDA Code
- GPU Profiling on NVIDIA Jetson Platforms
