portopt
Portfolios on constrained efficient frontier
portopt has been partially removed and will no longer accept
ConSet or varargin arguments. Use Portfolio instead to solve portfolio problems that are more than a
long-only fully-invested portfolio. For information on the workflow when using
Portfolio objects, see Portfolio Object Workflow. For more information on migrating
portopt code to Portfolio, see portopt Migration to Portfolio Object.
Syntax
Description
[
sets up the most basic portfolio problem with weights greater than or equal to
PortRisk,PortReturn,PortWts] = portopt(ExpReturn,ExpCovariance)0 that must sum to 1. All that is
necessary to solve this problem is the mean and covariance of asset returns. By
default, portopt returns 10 equally-spaced points on the
efficient frontier.
portopt solves the "standard" mean-variance portfolio
optimization problem for a long-only fully-invested investor with no additional
constraints. Specifically, every portfolios on the efficient frontier has
non-negative weights that sum to 1.
Note
An alternative for portfolio optimization is to use the Portfolio object for
mean-variance portfolio optimization. This object supports gross or net
portfolio returns as the return proxy, the variance of portfolio returns as
the risk proxy, and a portfolio set that is any combination of the specified
constraints to form a portfolio set. For information on the workflow when
using Portfolio objects, see Portfolio Object Workflow.
[
specifies options using one or more optional arguments in addition to the input
arguments in the previous syntax.PortRisk,PortReturn,PortWts] = portopt(___,NumPorts,PortReturn)
portopt(___,
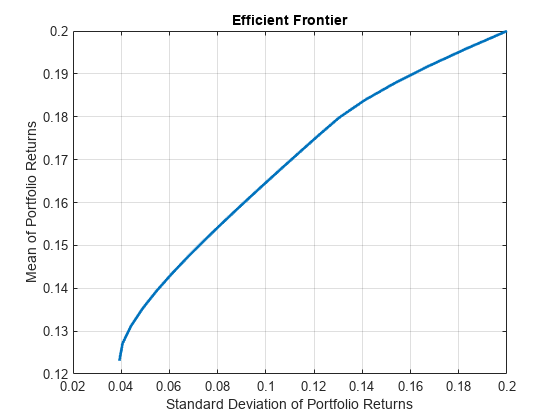
returns a plot of the efficient frontier if NumPorts,PortReturn)portopt is invoked
with no output arguments.
Examples
Input Arguments
Output Arguments
Version History
Introduced before R2006a
See Also
ewstats | frontier | portstats | portcons | Portfolio
Topics
- Portfolio Construction Examples
- Plotting an Efficient Frontier Using portopt
- Portfolio Selection and Risk Aversion
- Bond Portfolio Optimization Using Portfolio Object
- Active Returns and Tracking Error Efficient Frontier
- portopt Migration to Portfolio Object
- Analyzing Portfolios
- Portfolio Optimization Functions

