Cluster Analysis
Cluster analysis, also called segmentation analysis or taxonomy analysis, partitions sample data into groups, or clusters. Clusters are formed such that objects in the same cluster are similar, and objects in different clusters are distinct. Statistics and Machine Learning Toolbox™ provides several clustering techniques and measures of similarity (also called distance metrics) to create the clusters. Additionally, cluster evaluation determines the optimal number of clusters for the data using different evaluation criteria. Cluster visualization options include dendrograms and silhouette plots. The toolbox also provides several anomaly detection features to identify outliers and novelties.
Cluster Analysis Basics
Categories
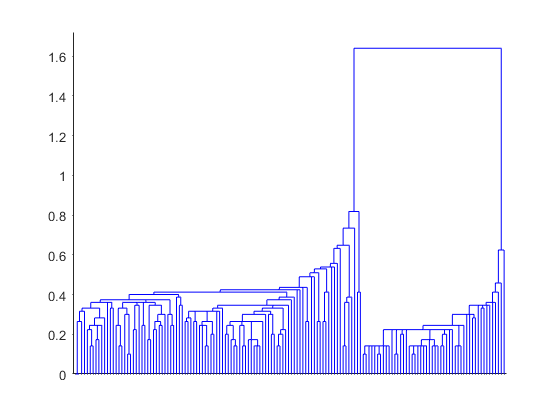
- Hierarchical Clustering
Produce nested sets of clusters
- k-Means and k-Medoids Clustering
Cluster by minimizing mean or medoid distance, and calculate Mahalanobis distance
- Density-Based Spatial Clustering of Applications with Noise
Find clusters and outliers by using the DBSCAN algorithm
- Spectral Clustering
Find clusters by using graph-based algorithm
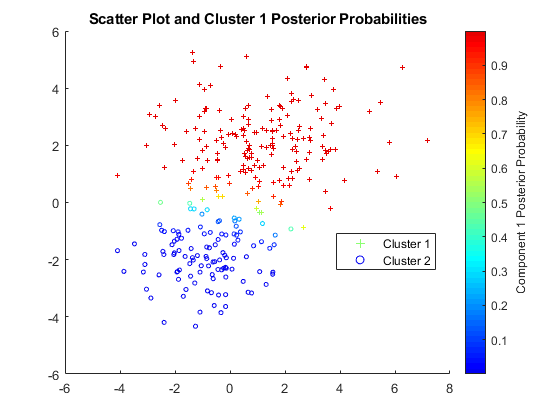
- Gaussian Mixture Models
Cluster based on Gaussian mixture models using the Expectation-Maximization algorithm
- Nearest Neighbors
Find nearest neighbors using exhaustive search or Kd-tree search
- Hidden Markov Models
Markov models for data generation
- Anomaly Detection
Detect outliers and novelties
- Cluster Visualization and Evaluation
Plot clusters of data and evaluate optimal number of clusters


