Verifying LTE Designs Using Live Signals and Test and Measurement Equipment
A key requirement for LTE or LTE-Advanced system design and verification is the ability to work with live LTE signals. Engineers require software that provides the ability to interface designs or algorithms with live signals using test and measurement equipment for evaluation and verification.
Together with Instrument Control Toolbox™ and LTE System Toolbox™, MATLAB® lets you design LTE algorithms and systems, and analyze or visualize live LTE signals. LTE System Toolbox includes LTE standard-compliant functions and tools that help to design, simulate, and verify LTE communications systems. Instrument Control Toolbox connects MATLAB to test equipment in order to generate and analyze live LTE signals.
This example demonstrates a signal generation and capture using a radio frequency (RF) signal generator and analyzer as part of an LTE system design verification process (Figure 1). We download a baseband waveform, synthesized in MATLAB using LTE System Toolbox, to a signal generator for over-the-air transmission. A signal analyzer is then used to capture the over-the-air signal, which is analyzed in MATLAB.
Creating a Baseband Waveform
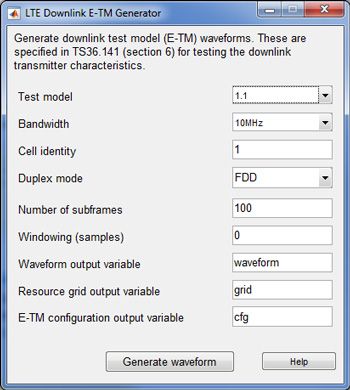
We use LTE System Toolbox to generate standard baseband IQ downlink test model (E-TM) waveforms along with uplink and downlink reference measurement channel (RMC) waveforms. The waveforms are generated from a parameter-driven interface (Figure 2).

An alternative approach includes using the functions lteTestModel and lteTestModelTool, which allow programmatic configuration and generation of LTE test models and baseband IQ waveforms.
cfg = lteTestModel(‘1.1’,’10MHz’); % Test Model 1.1, 10 MHz bandwidth
cfg.TotSubframes = 100; % Generate 100 subframes
[waveform, tmgrid, cfg] = lteTestModelTool(cfg); % Generate waveform
Generating an Over-the-Air Signal Using an RF Signal Generator
We use Instrument Control Toolbox to download and play the test model waveform created by MATLAB and LTE System Toolbox using a signal generator. The LTE System Toolbox helper function hDownloadAndPlayWaveformUsingN5172B.m is used to interface with an Agilent Technologies® N5172B Signal Generator.
txaddress = ‘192.168.10.1’;
% Instrument address iq = waveform;
% IQ data sr = cfg.SamplingRate; % Sampling rate (Hz)
fc = 1e9; % Center frequency (Hz)
power = 0; % Output power (dBm)
hDownloadAndPlayWaveformUsingN5172B(txaddress,iq,sr,fc,power);
Acquiring the Baseband Signal in MATLAB from a Signal Analyzer
To analyze an over-the-air transmission in MATLAB, we use Instrument Control Toolbox to configure the signal analyzer and capture baseband IQ data. The helper function hCaptureIQUsingN9010A.m is an example of a function that can be used with an Agilent Technologies N9010A signal analyzer. This function retrieves the baseband IQ data rxwaveform and the sample rate capsr from the signal analyzer. This data, which is ready for analysis, is imported into MATLAB using the following code:
rxaddress = ‘192.168.10.2’; % Instrument address
t = cfg.TotSubframes*1e-3; % Capture time (s), one subframe is 1 ms
fc = 1e9; % Center frequency (Hz)
bw = 10e6; % Bandwidth (Hz)
trig = false; % External trigger
[rxwaveform, capsr] = hCaptureIQUsingN9010A(rxaddress,t,fc,bw,trig);
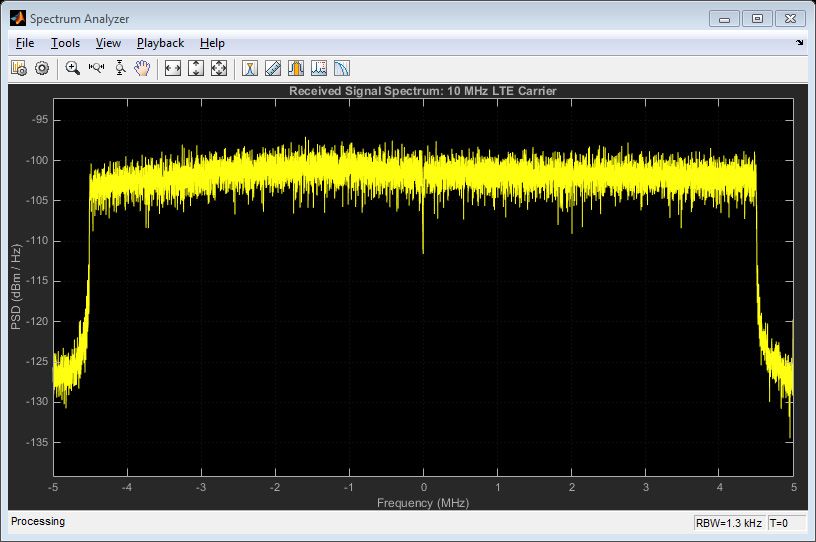
The DSP System Toolbox™ spectrum analyzer plots the frequency spectrum of the retrieved time-domain baseband waveform (Figure 3) using the code shown below that figure. The plot shows the expected 10 MHz occupied bandwidth and the impairments due to RF transmission and reception.
hsa = dsp.SpectrumAnalyzer(‘SampleRate’,capsr, ...
‘SpectrumType’,’Power density’,’PowerUnits’,’dBm’, ...
‘RBWSource’,’Property’,’RBW’,1.3e3,...
‘FrequencySpan’,’Span and center frequency’,’Span’,bw, ...
‘CenterFrequency’,0,’Window’,’Rectangular’,’SpectralAverages’,10, ...
‘YLabel’,’PSD’,’ShowLegend’,false, ...
‘Title’,’Received Signal Spectrum: 10 MHz LTE Carrier’);
step(hsa,rxwaveform);
Preparing the Captured LTE Signal for Analysis
To analyze the received waveform, we must know a number of system parameters. LTE System Toolbox provides functions to generate the standard system parameters for E-TMs and downlink and uplink RMCs.
 % System parameters for Test Model 1.1, 10 MHz bandwidth
cfg = lteTestModel(‘1.1’,’10MHz’);
System parameters are alternatively obtained through blind decoding using LTE System Toolbox receiver functions. To learn more, see the example Cell Search, MIB, and SIB1 Recovery [1].
To recover the resource grid, we resample the received waveform to the sample rate required for OFDM demodulation and then synchronize it to the first frame boundary. Finally, the received waveform is demodulated to recover the resource grid, as shown in the following code:
% Obtain sampling rate and resample for OFDM demodulation
info = lteOFDMInfo(cfg);
cfg.SamplingRate = info.SamplingRate;
rxwaveform = resample(rxwaveform,cfg.SamplingRate,capsr);
% Synchronize to the first frame head
offset = lteDLFrameOffset(cfg,rxwaveform);
rxwaveform = rxwaveform(1+offset:end,:);

% OFDM demodulate to recover resource grid
rxgrid = lteOFDMDemodulate(cfg,rxwaveform);
Capturing Signal Analysis
We now analyze the recovered waveform rxwaveform and resource grid rxgrid. LTE System Toolbox provides functions and examples for signal analysis, including adjacent channel leakage power ratio (ACLR) and error vector magnitude (EVM).
LTE System Toolbox helper functions hACLRMeasurementEUTRA.m and hACLRMeasurementUTRA.m measure the E-UTRA and UTRA ACLR for the received waveform. To learn more about ACLR measurement, see the example LTE Downlink Adjacent Channel Leakage Power Ratio (ACLR) Measurement [2].
% Calculate ACLR measurement parameters
rmc.UTRAChipRate = 3.84; % UTRA chip rate in MCPS
[aclr, nRC, R _ C, BWUTRA] = hACLRParameters(cfg);
% Apply required oversampling
resampled = resample(rxwaveform,aclr.OSR,1);
% Measure E-UTRA ACLR
aclr = hACLRMeasurementEUTRA(aclr,resampled);
aclr = hACLRMeasurementUTRA(aclr,resampled,nRC,R_C,BWUTRA);
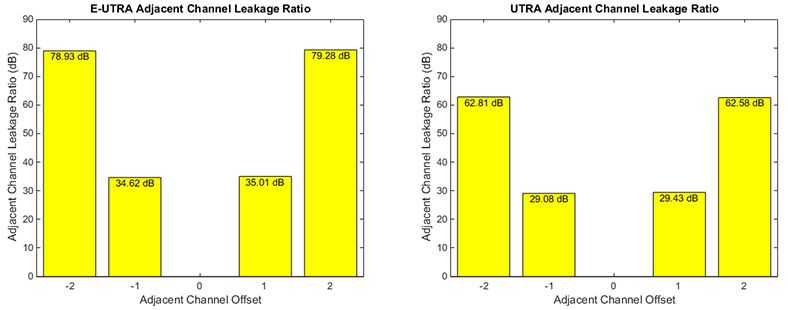
MATLAB can create custom plots for data visualization, as shown in the graphs depicting ACLR measurement results (Figure 4).
The helper function hPDSCHEVM.m measures the PDSCH EVM. For more information about measuring EVM, see PDSCH Error Vector Magnitude (EVM) Measurement [3] and LTE Uplink EVM and In-Band Emissions Measurements [4].
% Configure the channel estimator to average over frequency and time
cec.PilotAverage = ‘UserDefined’;
cec.FreqWindow = 9;
cec.TimeWindow = 9;
cec.InterpType = ‘cubic’;
cec.InterpWinSize = 3;
cec.InterpWindow = ‘Causal’;
% Perform EVM measurement
evmMeas = hPDSCHEVM(cfg,cec,rxwaveform);
The returned structure contains the measured peak EVM (5.0%), RMS EVM (1.2%), and an array, EV, containing the error vector for each PDSCH symbol.
evmmeas =
Peak: 0.0509
RMS: 0.0127
EV: [10464x1 double]
Summary
This example illustrated how to use Instrument Control Toolbox when working with live LTE signals. We created a baseband waveform using LTE System Toolbox and generated an over-the-air signal using an RF signal generator. We captured this signal and then analyzed it using MATLAB and Instrument Control Toolbox. This process streamlines the design and verification of LTE systems by expediting hardware test and measurement when working with live LTE signals.
References
Published 2015 - 80713v00


