Measure Temperature and Control Peripherals Using the Arduino Explorer App
This example helps you to use the Arduino® Explorer app to connect to an Arduino board and control attached peripherals depending on the temperature variations.
In this example the Arduino board is attached to three peripherals: a servo motor, an LED, and a temperature sensor.
The app provides a unified interface to monitor inputs from the temperature sensor and to provide outputs to the LED and servo motor peripherals.
To open the app, on the MATLAB® Toolstrip, on the Apps tab, in the Test and Measurement section, click Arduino Explorer. 
Requirements
To run this example, you must have the following hardware:
Arduino® board
Analog output temperature sensor
Servo motor
LED
Resistor
Measure Temperature and Control Peripherals Using the Arduino Explorer App
The Arduino board has already been configured and connected over the USB. If the board needs pre-configuration see, Set up and Configure Arduino Hardware.
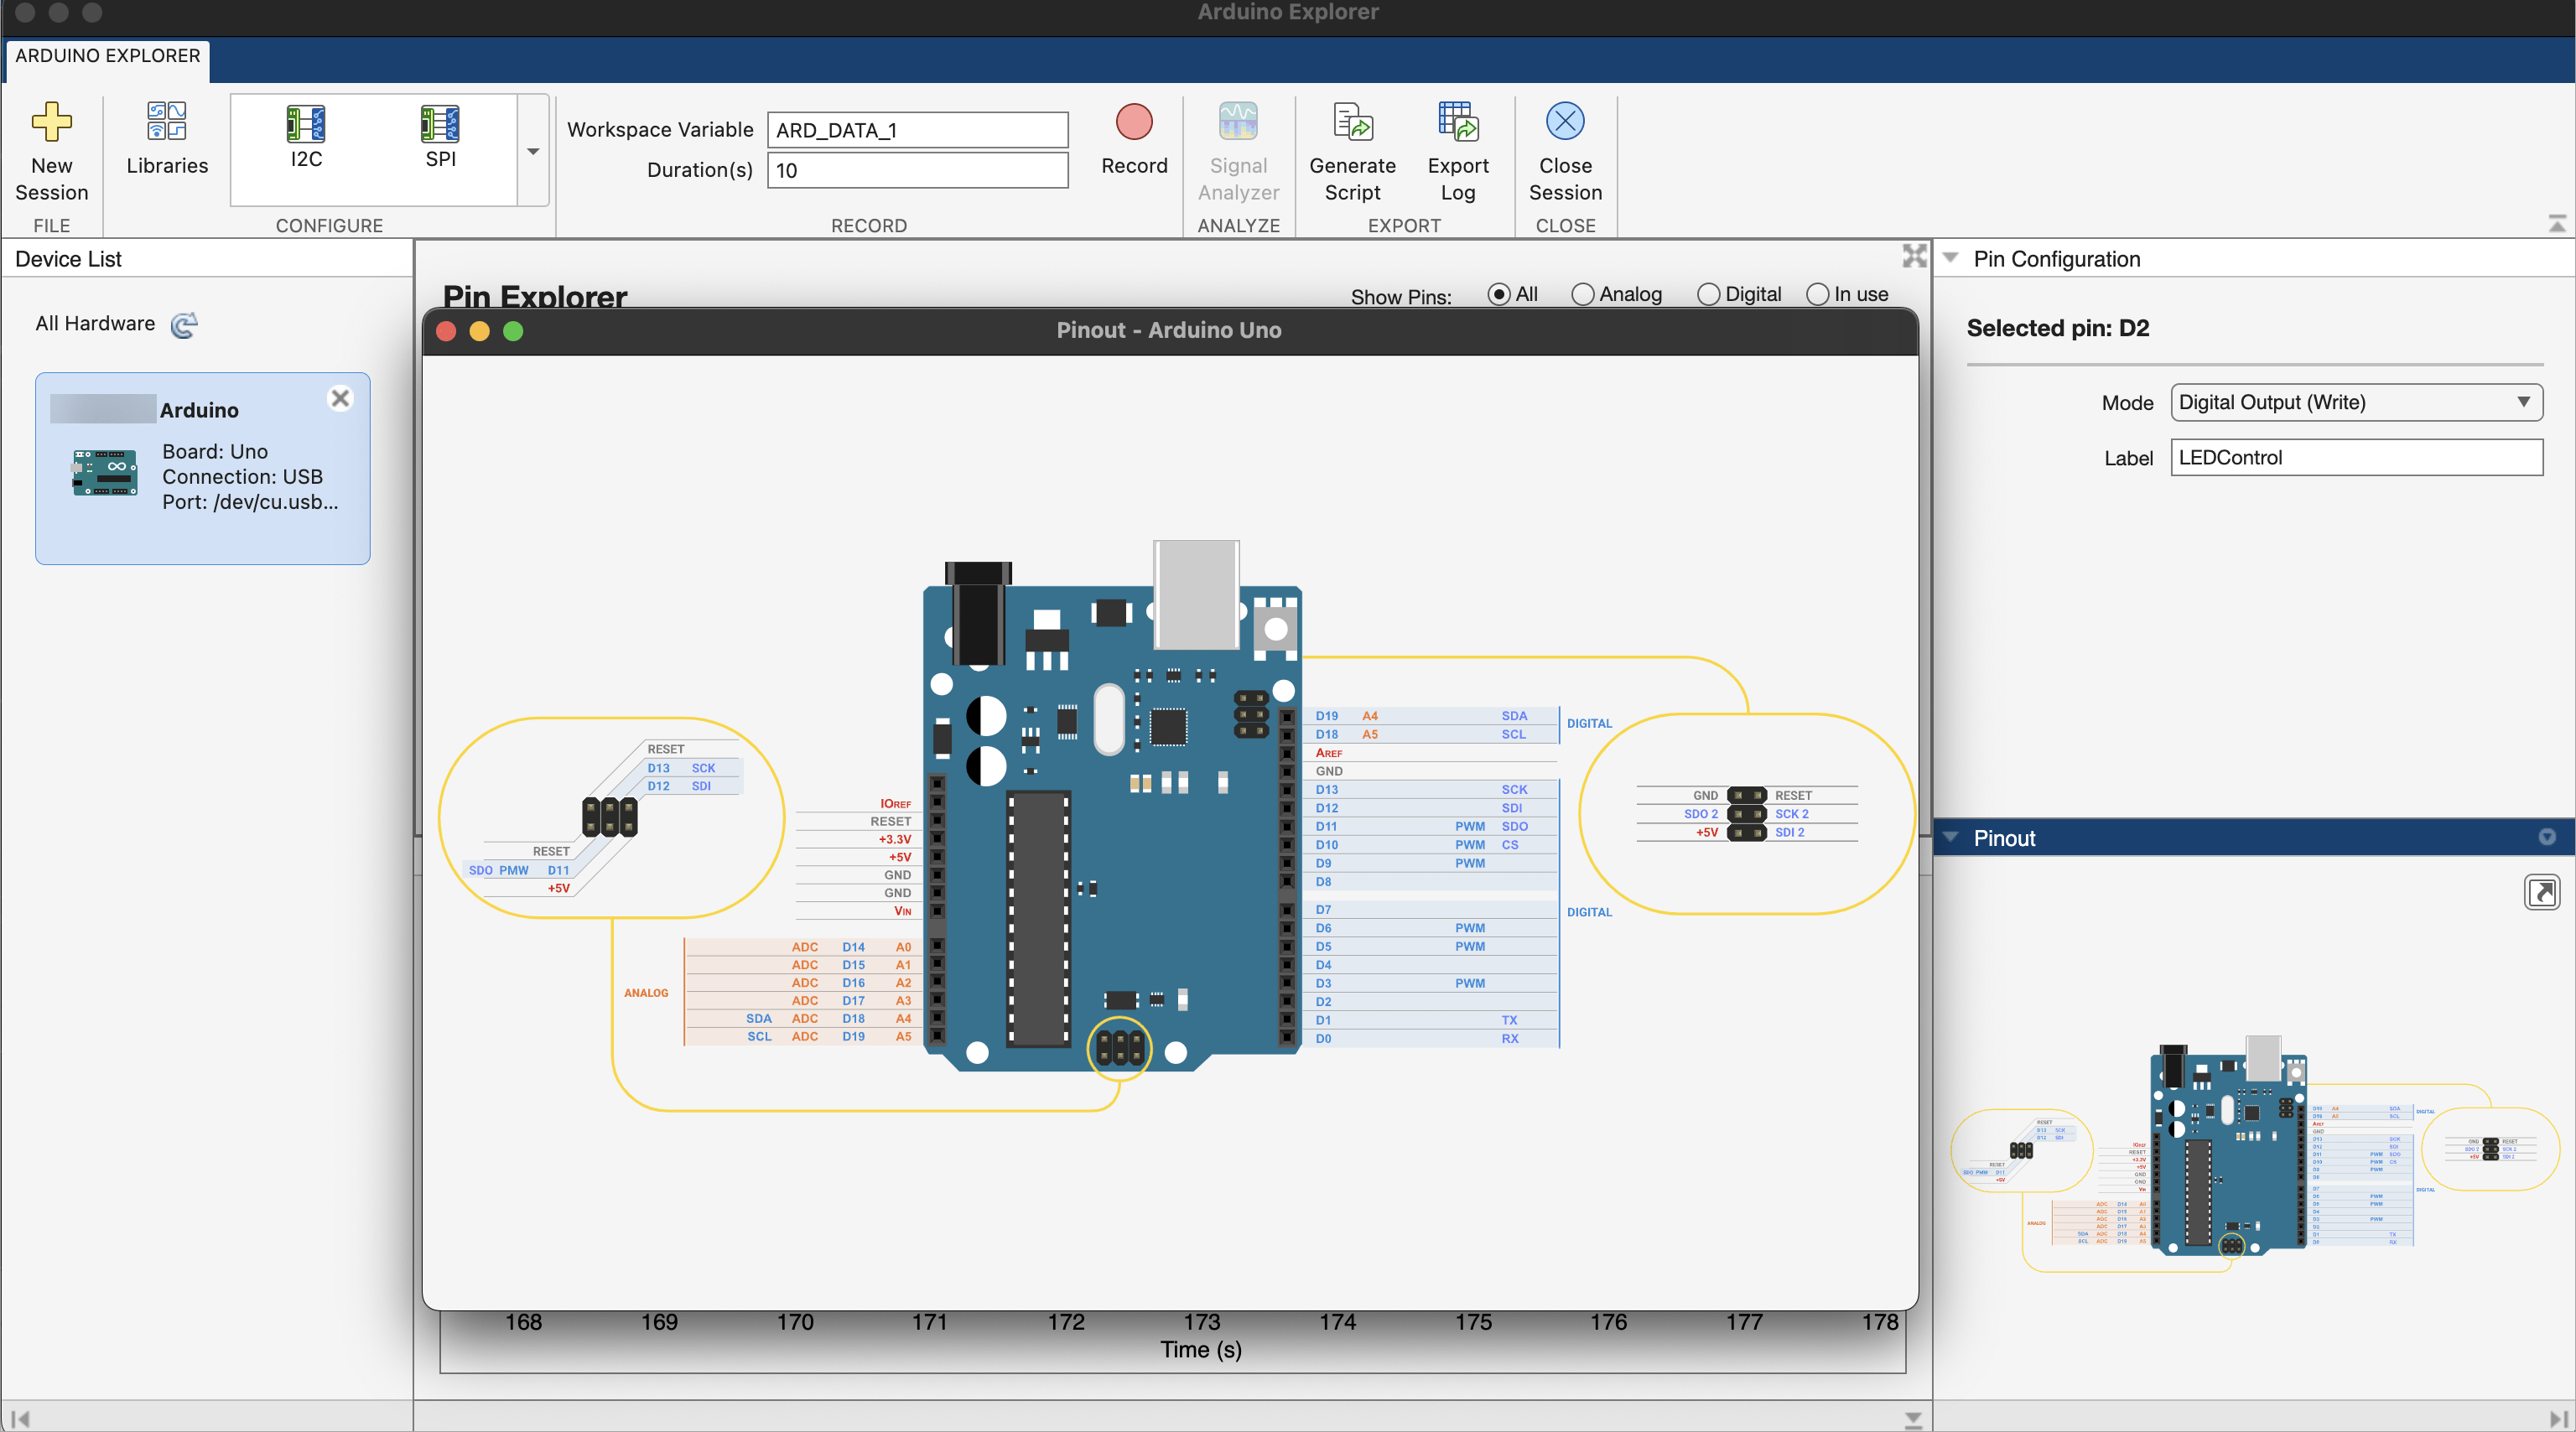
Use the Pinout panel to view the pinout diagram of the board. The pinout diagram helps you to identify the Arduino Pins to connect the peripherals to the board.
Configure the Arduino Board
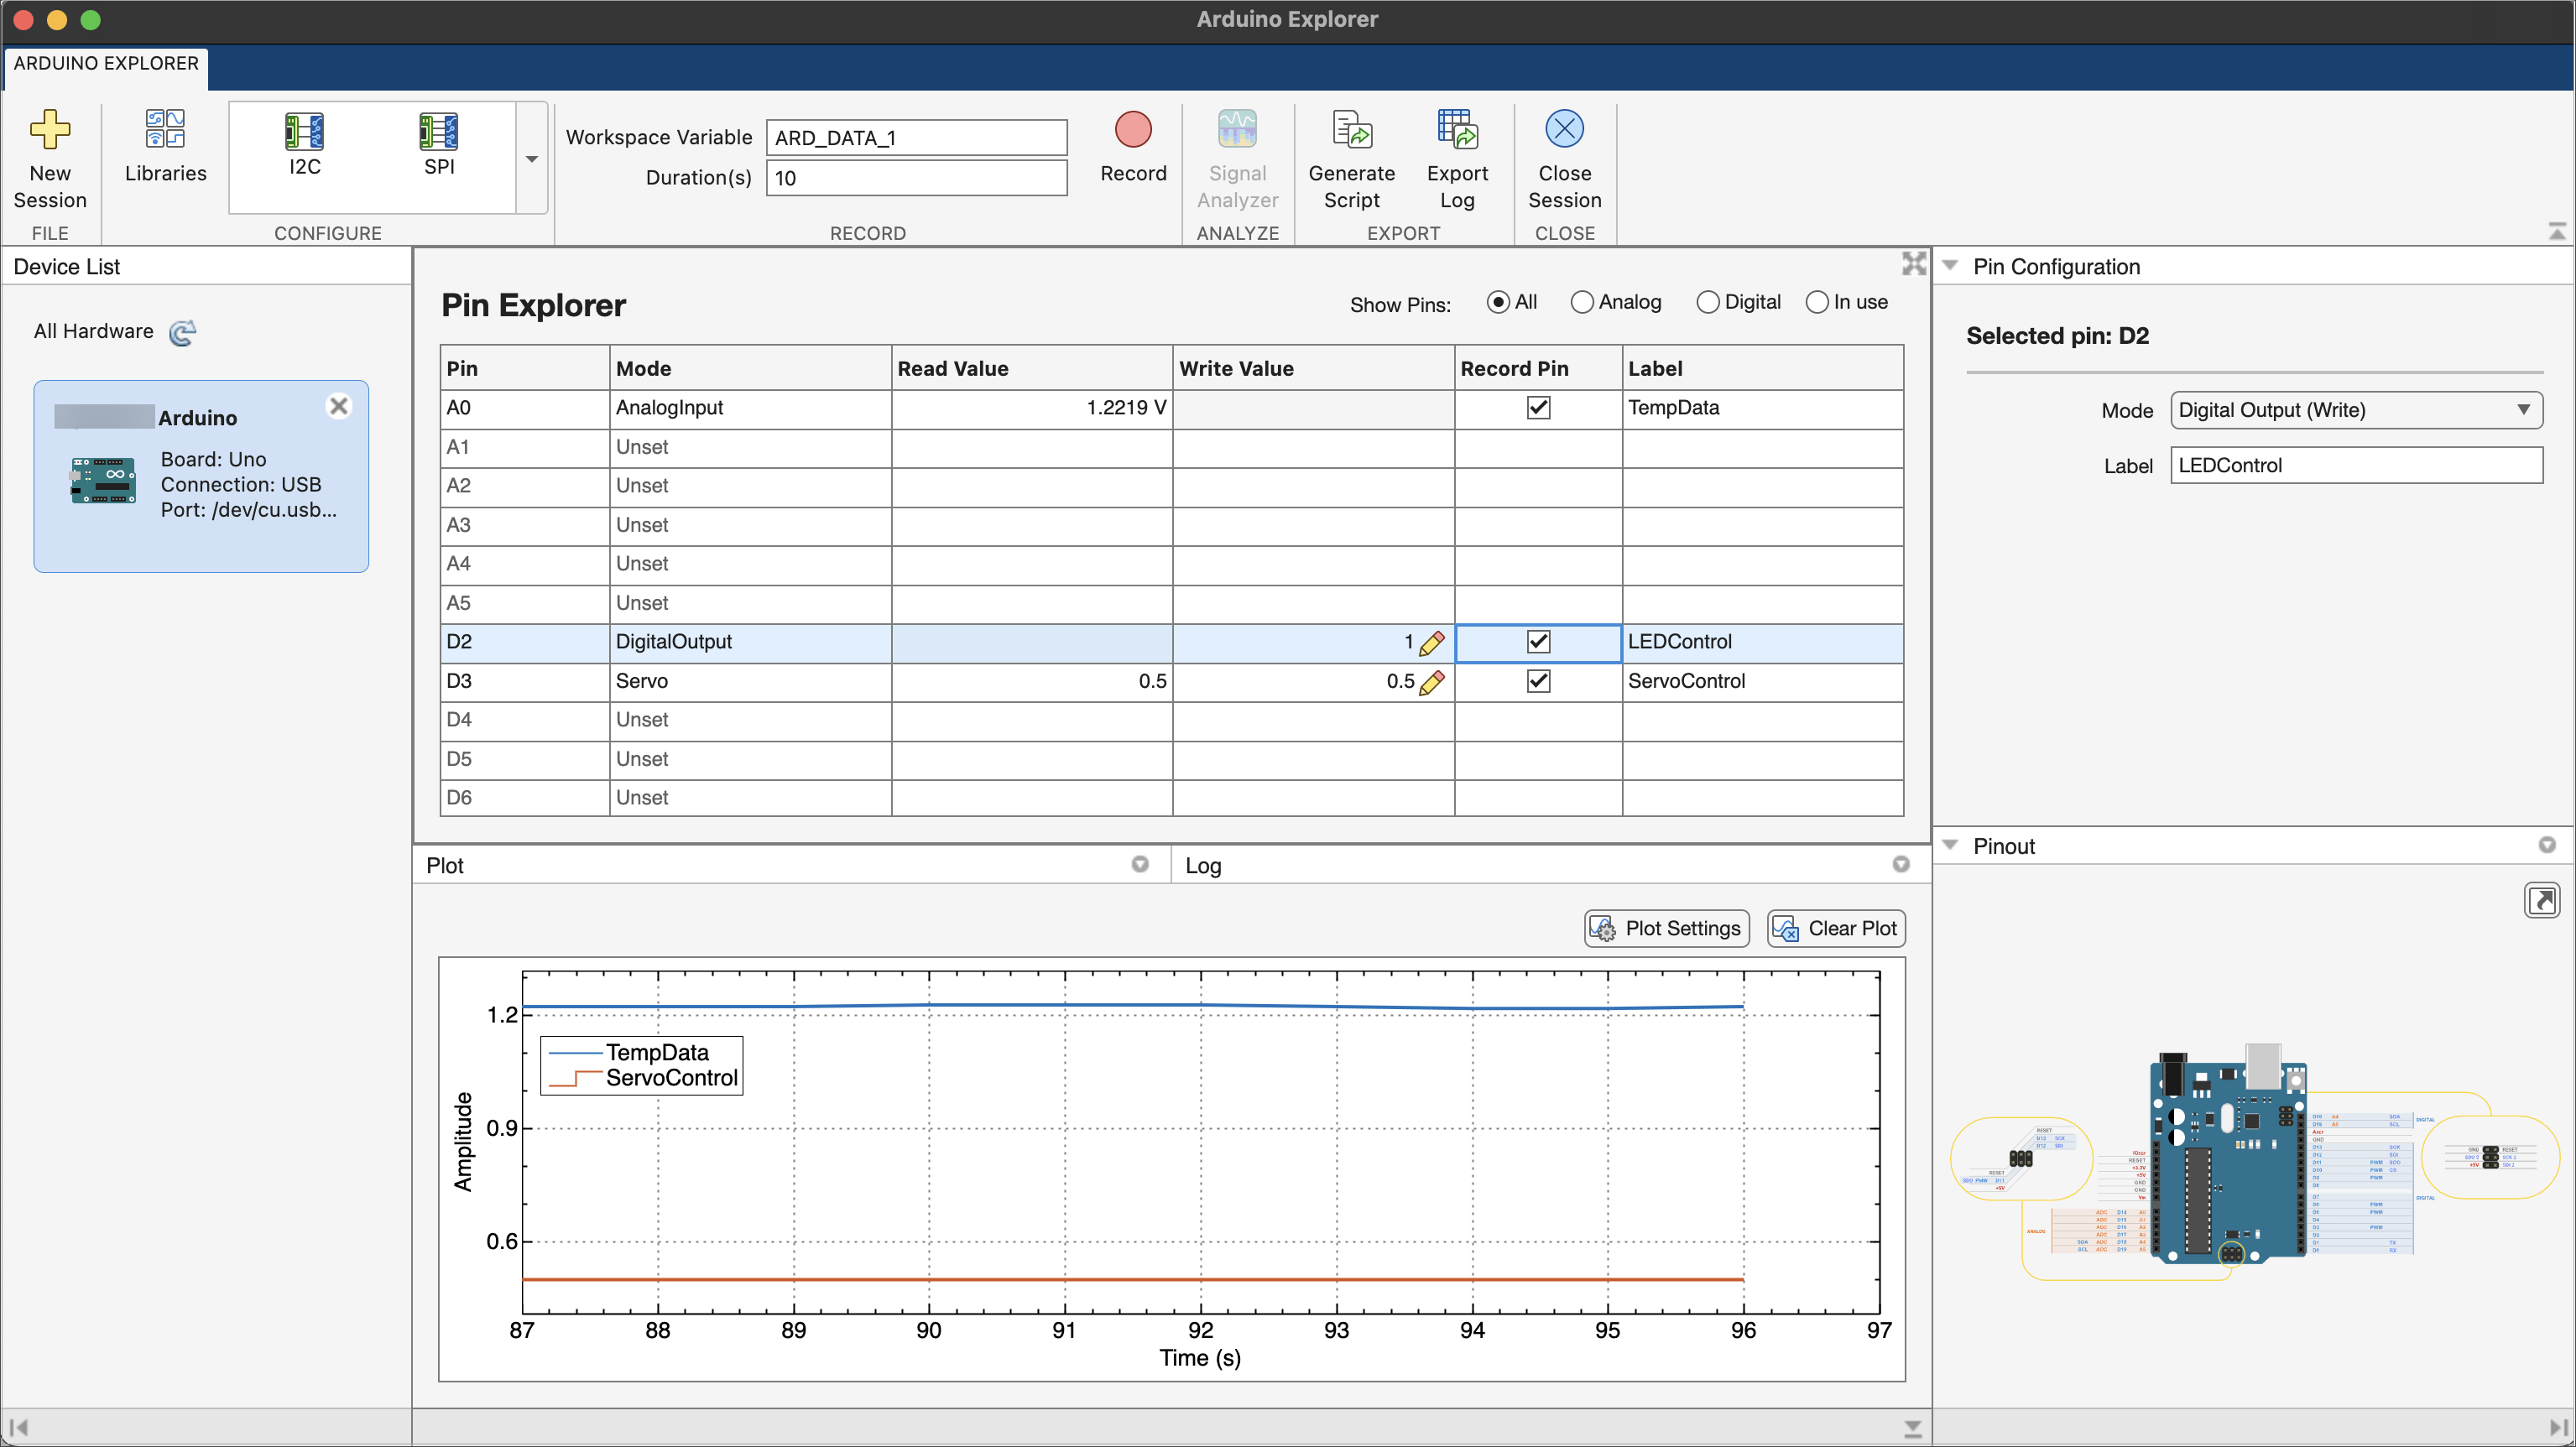
Set up an analog pin A0 of the Arduino to receive analog inputs from the temperature sensor. On the Pin Configuration pane, choose the row A0. In the Configure pin panel set the Mode as AnalogInput and the Custom Name as TempData.
The Arduino Explorer App automatically plots the input data in the timescope. You may turn off plotting by deselecting the pin in the Plot Pins pane. Similarly, set the Mode of digital pins D2 and D3, as DigitalOutput and Servo. You may also provide custom names to these pins. Note: Arduino Explorer App plots pins that are in Read or Input mode.
The Read Value pane displays the incoming values of the pins. Pin A0 displays the input voltage from the temperature sensor. Pin D2 displays the current angle of the servo motor shaft (normalized).
You can use the Write Value to write data to the Arduino pins. Writing 1 to the digital pin D2 will make the LED glow. For D3, writing a value that is different from the read value, will rotate the servo motor shaft.
You may also record the data of the pins by selecting the Record Pin option under Pin Configuration, and by clicking Record in the toolstrip. This data is recorded in the workspace variables for the specified duration.
If you have the Signal Processing Toolbox, the recorded data can also be visualized using the Signal Analyzer app by clicking on the Signal Analyzer Toolstrip button.
In the Arduino Explorer app toolstrip, click Generate Script, to open the MATLAB live editor and display the equivalent MATLAB code. The code contains commands to create an Arduino® connection, configure Arduino pins and to read and write data.
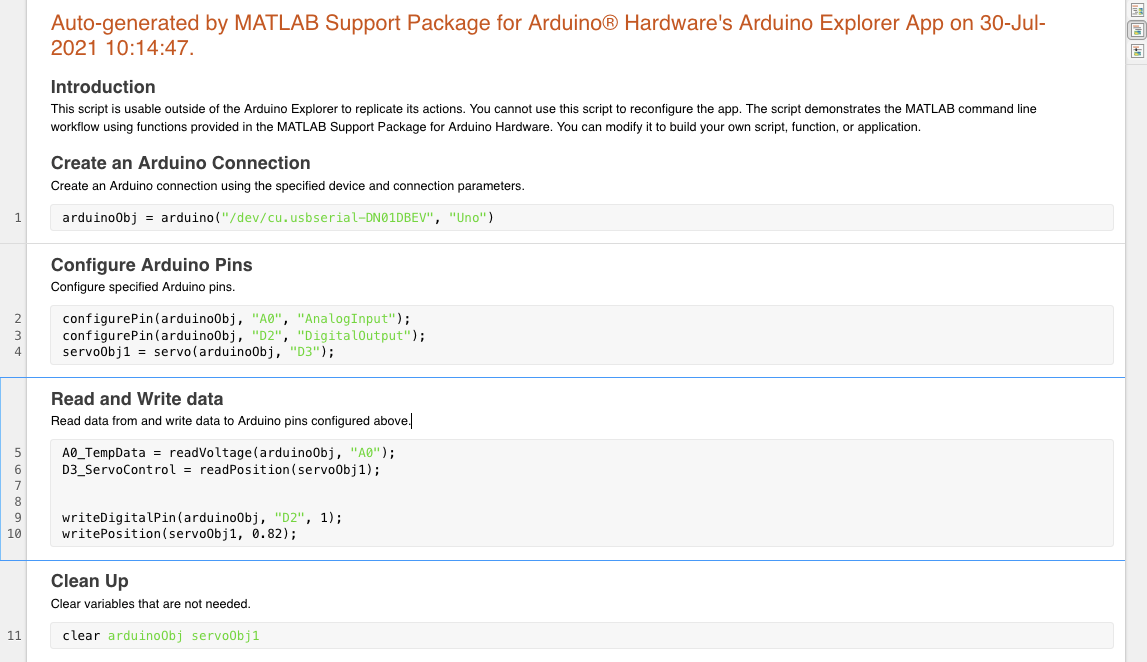
You may add your own logic to the code, control the setup.
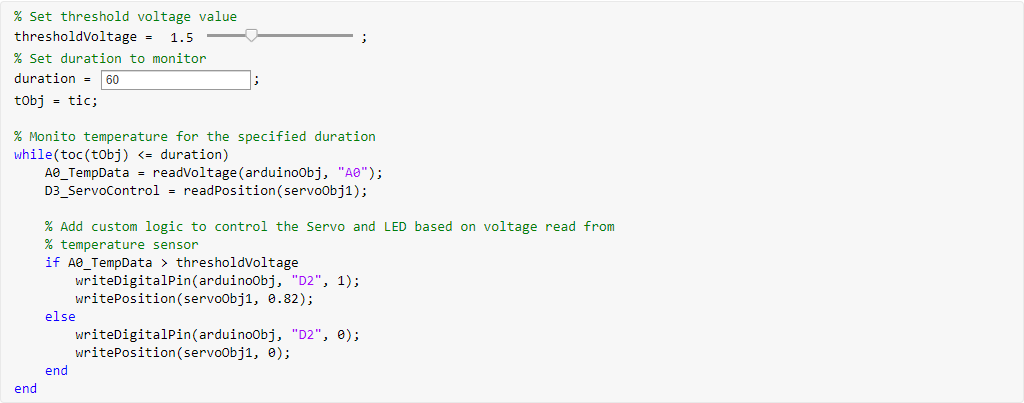
Now the setup is ready to control the servo motor when the temperature voltage increases beyond the thresholdVoltage.
