Represent Operating Modes by Using States
A state describes an operating mode of a reactive system. In a Stateflow® chart, states are used for sequential design to create state transition diagrams.
During simulation, states can be active or inactive. The activity of a state changes depending on events and conditions. Events drive the execution of the state transition diagram by making states become active or inactive. For more information, see Execution of a Stateflow Chart.
To represent multiple levels of components in a system, create a hierarchy of states by nesting substates inside superstates. For more information, see Use State Hierarchy to Design Multilevel State Complexity.
To model mutually exclusive operating modes, enable exclusive (OR) decomposition in a state so at most one of its substates is active at the same time. To implement operating modes that run concurrently, enable parallel (AND) decomposition in a state so all of its substates are active at the same time. For more information, see Define Exclusive and Parallel Modes by Using State Decomposition.
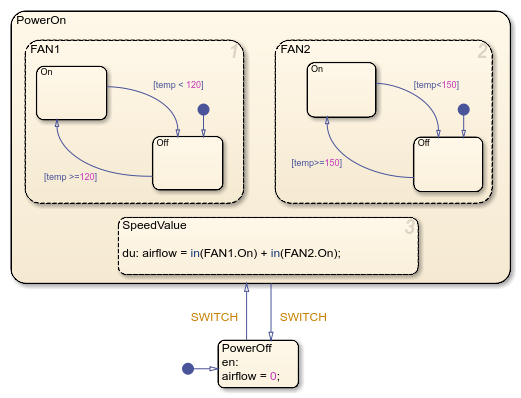
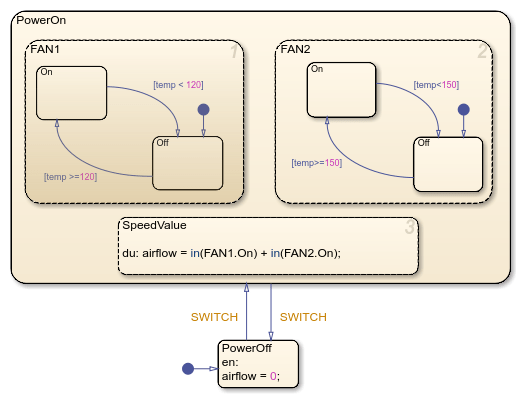
For example, in this chart, the states PowerOn and
PowerOff represent the on and off modes of an air controller system. In
the state PowerOn, the parallel substates FAN1 and
FAN2 represent the operating modes of a pair of fans. Each of these
states contains exclusive substates called On and Off.
For more information on this example, see Model Synchronous Subsystems by Using Parallel Decomposition.
Create a State
To add a state to a Stateflow chart:
Open the chart.
In the object palette, click the State icon
 .
.On the chart canvas, click the location for the new state.
Enter a label for the state and click outside of the state. The label specifies the name of the state and any optional actions that the state executes during simulation. For more information, see Define Actions in a State.
After you create a state, you can use the Stateflow Editor to change the size, position, and contents of the state:
To resize the state, click and drag the corner of the state.
To move the state, click and drag the interior of the state.
To edit the state label, click the label text near the character position you want to edit.
Tip
A parent state must be graphically large enough to accommodate all its substates, so you may need to resize a parent state before dragging a new substate into it. Alternatively, you can convert a superstate into a subchart. For more information, see Encapsulate Modal Logic by Using Subcharts.
Define Actions in a State
The label for a state specifies the name of the state and any optional actions that the state executes during simulation. A state label appears on the top left corner of the state and consists of this general format:
name
entry: entry_actions
during: during_actions
exit: exit_actions
on event_name: on_event_actions
on message_name: on_message_actions
bind: event_name, data_name
State actions can appear in any order. For each type of action, you can specify more
than one statement by entering each statement on a separate line. Alternatively, to separate
multiple statements on the same line, use a comma or a semicolon. You can also combine
entry, during, and exit actions
that execute the same statements. For more information, see Eliminate Redundant Code by Combining State Actions.
Tip
If you add statements directly after the state name, the chart interprets these
statements as combined entry and during
actions.
State Name
A state label starts with the name of the state, followed by an optional slash
(/). State names are case sensitive and consist of a combination of
alphanumeric and underscore characters. For more information, see Guidelines for Naming Stateflow Objects.
To avoid naming conflicts, do not assign the same name to sibling states. However, you
can use the same state name for multiple states if the full name of each state is unique.
The full name of a state consists of the sequence of ancestor names in the state
hierarchy, separated by periods. For instance, in the previous example, the states in
FAN1 and FAN2 are identified by these unique full names:
PowerOn.FAN1.OnPowerOn.FAN1.OffPowerOn.FAN2.OnPowerOn.FAN2.Off
Entry Actions
To add an entry action, enter entry or
en, followed by a colon (:) and one or more
statements. The chart executes these statements when the state becomes active. For
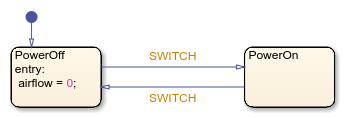
example, in this chart, the entry action in state
PowerOff sets the value of airflow to zero when
the air controller system turns off. For more information, see Enter a Chart or State.
During Actions
To add a during action, enter during or
du, followed by a colon (:) and one or more
statements. The chart executes these statements when the state is active and there are no
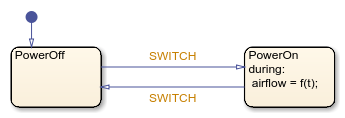
valid transitions to another state. For example, in this chart, the
during action in state PowerOn calculates the
value of airflow when the air controller system is on. For more
information, see Execution of a Stateflow Chart.
Exit Actions
To add an exit action, enter exit or
ex, followed by a colon (:) and one or more
statements. The chart executes these statements when the state is active and a transition
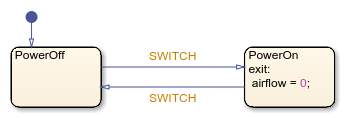
out of the state occurs. For example, in this chart, the exit action in
state PowerOn sets the value of airflow to zero when
the air controller system turns off. For more information, see Exit a State.
On Actions
To add an on action, enter on, followed by the
name of an event or message, a colon (:), and one or more statements.
The chart executes these statements when the state is active and it receives the specified
event or message. For more information, see Synchronize Model Components by Broadcasting Events and Communicate with Stateflow Charts by Sending Messages.
You can specify on actions for more than one event or message. For
example, this state contains different on actions for the events
E1 and E2.
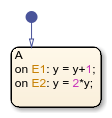
If multiple events occur at the same time, the corresponding on
actions execute in the order that they appear in the state label. For more information,
see Execution of a Stateflow Chart.
Tip
You can use implicit events (such as change, enter, or exit) and temporal logic operators
(such as after, at,
before, or every) to trigger on actions in states. For more
information, see Control Chart Behavior by Using Implicit Events and Control Chart Execution by Using Temporal Logic.
Bind Actions
To add a bind action, enter bind, followed by a
colon (:) and the name of one or more events or data objects. To
separate multiple events and data, use semicolons or commas or enter the events and data
on separate lines. For example, in this chart, state A contains a
bind action that binds the event E and the data
object x to the state.
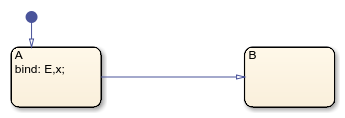
A bind action applies regardless of whether the state is active or
inactive. Other states can read the bound data or listen for the bound events, but only
the state and its children can change the value of the bound data or broadcast the bound
events. Otherwise, a compile-time error occurs.
Binding a function-call event to a state also binds the function-call subsystem that the event calls. The function-call subsystem is enabled when the binding state is active and disabled when the binding state is inactive. For more information, see Control Function-Call Subsystems by Using bind Actions.
If a chart includes actions that bind the same data or event to multiple states, a compile-time error occurs.
Standalone Stateflow charts in MATLAB® do not support bind actions.
Group States
You can simplify editing a chart by grouping the graphical contents of a state so they act as a single unit. For example, moving a grouped state also moves the substates, transitions, and other graphical objects inside that state. To group a state, right-click the state and select Group & Subchart > Group in the context menu.
You must ungroup a state before selecting objects inside the state or moving other graphical objects into the state. For example, trying to move a state or graphical function into a grouped state results in an invalid intersection error. To ungroup a state, right-click the state and clear Group & Subchart > Group in the context menu.
In the Stateflow Editor, grouped states appear darker than ungrouped states. For example, in
this chart, the state FAN1 is grouped while the state
FAN2 is not grouped.
Specify Properties for States
The properties listed below enable you to specify how a state interacts with the other components in your Stateflow chart. You can modify these properties in the Property Inspector, the Model Explorer, or the State properties dialog box.
To use the Property Inspector:
In the Modeling tab, under Design Data, select Property Inspector.
In the Stateflow Editor, select the state.
In the Property Inspector, edit the state properties.
To use the Model Explorer:
In the Modeling tab, under Design Data, select Model Explorer.
In the Model Hierarchy pane, select the state.
In the Dialog pane, edit the state properties.
To use the State properties dialog box:
In the Stateflow Editor, right-click the state.
Select Properties.
In the properties dialog box, edit the state properties.
You can also modify state properties programmatically by using Stateflow.State objects. For more information about the Stateflow programmatic interface, see Overview of the Stateflow API.
Name
Name of the state. This property is read-only. When you click the state name hyperlink in the Model Explorer and the State properties dialog box, the Stateflow Editor brings the state to the foreground.
Execution order
Execution order for a parallel (AND) state. This property does not appear for exclusive (OR) states. For more information, see Execution Order for Parallel States.
Create output for monitoring
Whether to create an active state data output port for the state. See Monitor State Activity Through Active State Data.
Function inline option
Appearance of the state functions in generated code. Options include:
Auto— An internal calculation determines the appearance of state functions in generated code.Inline— Calls to state functions are replaced by code as long as the function is not part of a recursion.Function— State functions are implemented as separate static functions.
For more information, see Inline State Functions in Generated Code (Simulink Coder). This property is not available in the Property Inspector.
Label
Label for the state. For more information, see Define Actions in a State. This property is not available in the Property Inspector.
Log self activity
Whether to enable signal logging. Signal logging saves the self activity of the state to the MATLAB workspace during simulation. For more information, see Log Simulation Output for States and Data.
Logging name
Signal name used to log the state activity.
To use the name of the state, select
Use state name.To specify a different name, select
Customand enter the custom logging name.
Limit data points to last
Whether to limit the number of logged data points to the specified maximum. For example, if you set the maximum number of data points to 5000, the chart logs only the last 5000 data points generated by the simulation.
Decimation
Whether to limit the amount of logged data by skipping samples using the specified decimation interval. For example, if you set a decimation interval of 2, the chart logs every other sample.
Test point
Whether to set the state as a test point that you can monitor with a floating scope during simulation. You can also log test point values to the MATLAB workspace. For more information, see Monitor Test Points in Stateflow Charts.
Description
Description of the state.
Document link
Link to online documentation for the state. You can enter a web URL address or a MATLAB command that displays documentation as an HTML file or as text in the MATLAB Command Window. When you click the Document link hyperlink, Stateflow evaluates the link and displays the documentation.
See Also
Objects
Tools
- Model Explorer (Simulink)
