Automate Control of Intelligent Vehicles by Using Stateflow Charts
This example shows how to model a highway scenario with intelligent vehicles that are controlled by the same decision logic. Each vehicle determines when to speed up, slow down, or change lanes based on the logic defined by a standalone Stateflow® chart. Because the driving conditions (including the relative position and speed of nearby vehicles) differ from vehicle to vehicle, separate chart objects in MATLAB® control the individual vehicles on the highway.
Open Driving Scenario
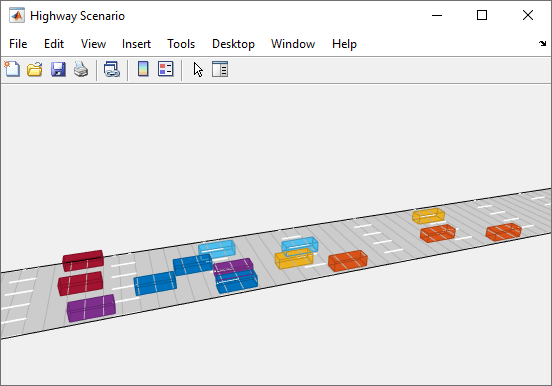
To start the example, run the script sf_driver_demo.m. The script displays a 3-D animation of a long highway and several vehicles. The view focuses on a single vehicle and its surroundings. As this vehicle moves along the highway, the standalone Stateflow chart sf_driver shows the decision logic that determines its actions.

Starting from a random position, each vehicle attempts to travel at a target speed. Because the target speeds are chosen at random, the vehicles can obstruct one another. In this situation, a vehicle will try to change lanes and resume its target speed.
The class file HighwayScenario defines a drivingScenario (Automated Driving Toolbox)drivingScenario object creates an array of Stateflow chart objects. Each chart object controls a different vehicle in the simulation.
Execute Decision Logic for Vehicles
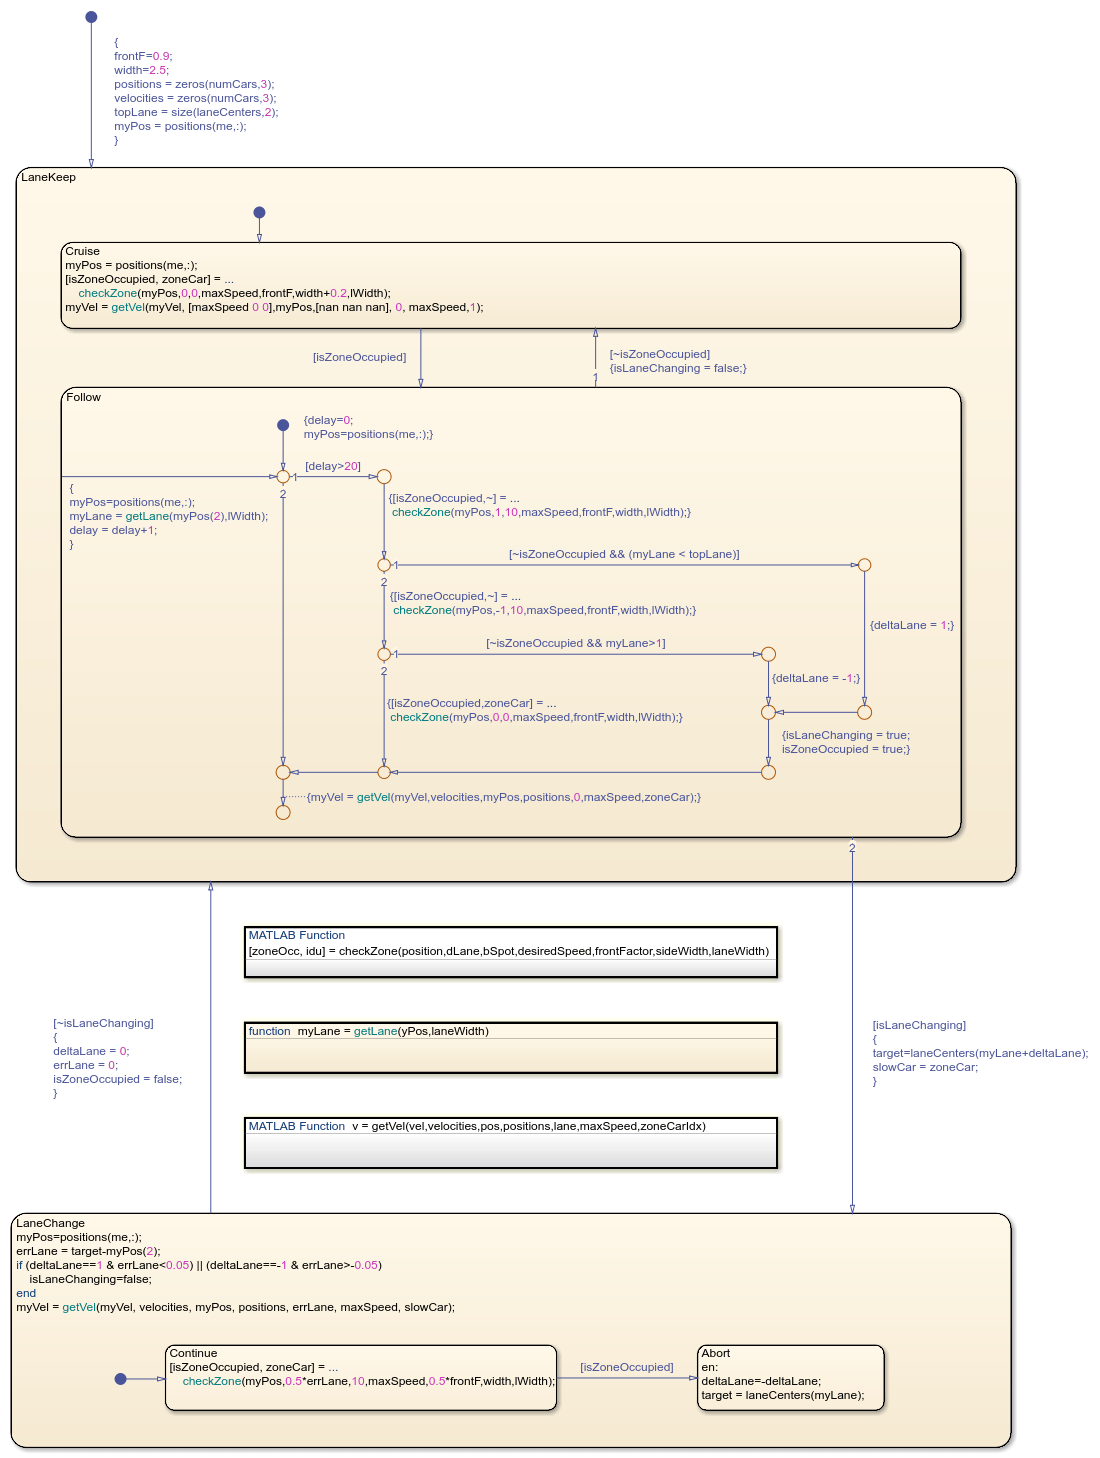
The Stateflow chart sf_driver consists of two top-level states, LaneKeep and LaneChange.
When the LaneKeep state is active, the corresponding vehicle stays in its lane of traffic. In this state, there are two possible substates:
Cruiseis active when the zone directly in front of the vehicle is empty and the vehicle can travel at its target speed.Followbecomes active when the zone directly in front of the vehicle is occupied and its target speed is faster than the speed of the vehicle in front. In this case, the vehicle is forced to slow down and attempt to change lanes.
When the LaneChange state is active, the corresponding vehicle attempts to change lanes. In this state, there are two possible substates:
Continueis active when the zone next to the vehicle is empty and the vehicle can change lanes safely.Abortbecomes active when the zone next to the vehicle is occupied. In this case, the vehicle is forced to remain in its lane.

The transitions between the states LaneKeep and LaneChange are guarded by the value of isLaneChanging. In the LaneKeep state, the chart sets this local data to true when the substate Follow is active and there is enough room beside the vehicle to change lanes. In the LaneChange state, the chart sets this local data to false when the vehicle finishes changing lanes.
See Also
drivingScenario (Automated Driving Toolbox)
Related Topics
- Create Stateflow Charts for Execution as MATLAB Objects
- Create Driving Scenario Programmatically (Automated Driving Toolbox)
- Create Actor and Vehicle Trajectories Programmatically (Automated Driving Toolbox)
- Define Road Layouts Programmatically (Automated Driving Toolbox)
