temporalCount
Number of events, chart executions, or time since state became active
Description
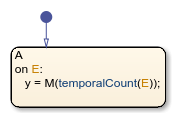
temporalCount( returns the number of
occurrences of the event E)E since the associated state became
active.
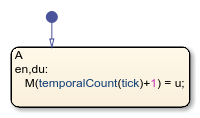
temporalCount( returns the number of
times that the chart has woken up since the associated state became active.tick)
The implicit event tick is not supported when a Stateflow® chart in a Simulink® model has input events.
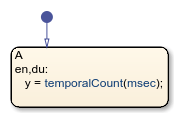
temporalCount( returns the length of
time that has elapsed since the associated state became active. Specify
time_unit)time_unit as seconds (sec), milliseconds
(msec), or microseconds (usec).
Note
Standalone Stateflow charts in MATLAB® support using temporalCount only as an absolute-time
temporal logic operator.
Examples
Tips
You can use quotation marks to enclose the keywords
'tick','sec','msec', and'usec'. For example,temporalCount('tick')is equivalent totemporalCount(tick).The Stateflow chart resets the counter used by the
temporalCountoperator each time the associated state reactivates.The timing for absolute-time temporal logic operators depends on the type of Stateflow chart:
Charts in a Simulink model define temporal logic in terms of simulation time.
Standalone charts in MATLAB define temporal logic in terms of wall-clock time.
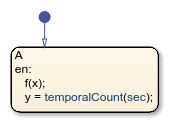
The difference in timing can affect the behavior of a chart. For example, suppose that this chart is executing the
entryaction of stateA.
In a Simulink model, the function call to
fexecutes in a single time step and does not contribute to the simulation time. After calling the functionf, the chart assigns a value of zero toy.In a standalone chart, the function call to
fcan take several seconds of wall-clock time to complete. After calling the functionf, the chart assigns the nonzero time that has elapsed since stateAbecame active toy.
Version History
Introduced in R2008a


