View and Filter Code Coverage Results Using the Code Pane
This example shows how to view code coverage results and justify code coverage outcomes directly from the Code pane in Simulink®.
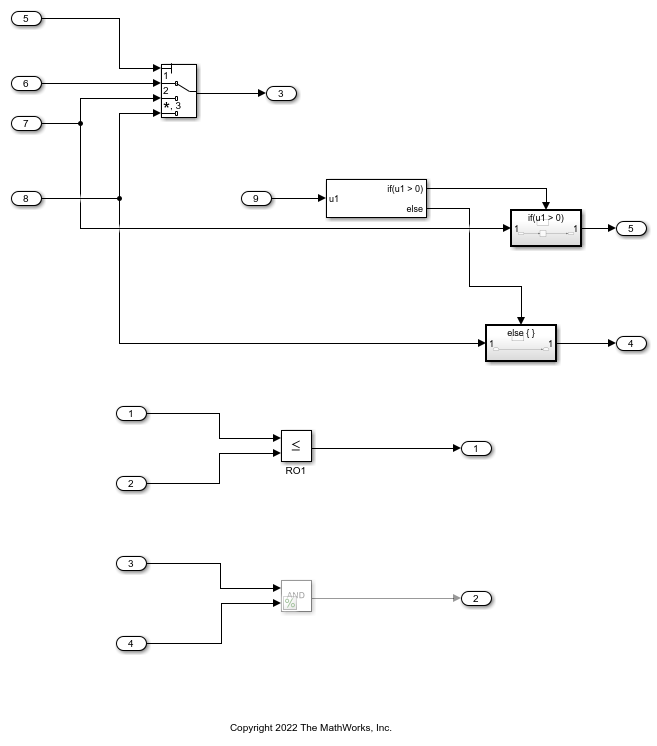
Configure Coverage Settings and Analyze the Model
First, ensure that coverage is enabled for the model. In the Simulink toolstrip, on the Modeling tab, click Model Settings. In the Configuration Parameters dialog box, in the Coverage pane, select Enable Coverage Analysis. Then set Structural coverage level to Condition Decision.
To run a simulation in software-in-the-loop (SIL) or processor-in-the-loop (PIL) mode, you can use the SIL/PIL Manager app. In the Simulink toolstrip, on the Apps tab, click SIL/PIL Manager.
In the SIL/PIL tab, set Mode to SIL/PIL Simulation Only. Click Run SIL/PIL.
View Coverage Results
When the simulation finishes, the Code pane displays the generated code overlayed with coverage annotations. The Code pane opens when you run the simulation from the SIL/PIL Manager app. You can open the code pane manually by opening the Embedded Coder app from the Apps tab and clicking View Code.
If you click a block, Simulink highlights the lines of generated code relevant to that block. For example, click the Multiport Switch block to highlight the code that starts at line 67.
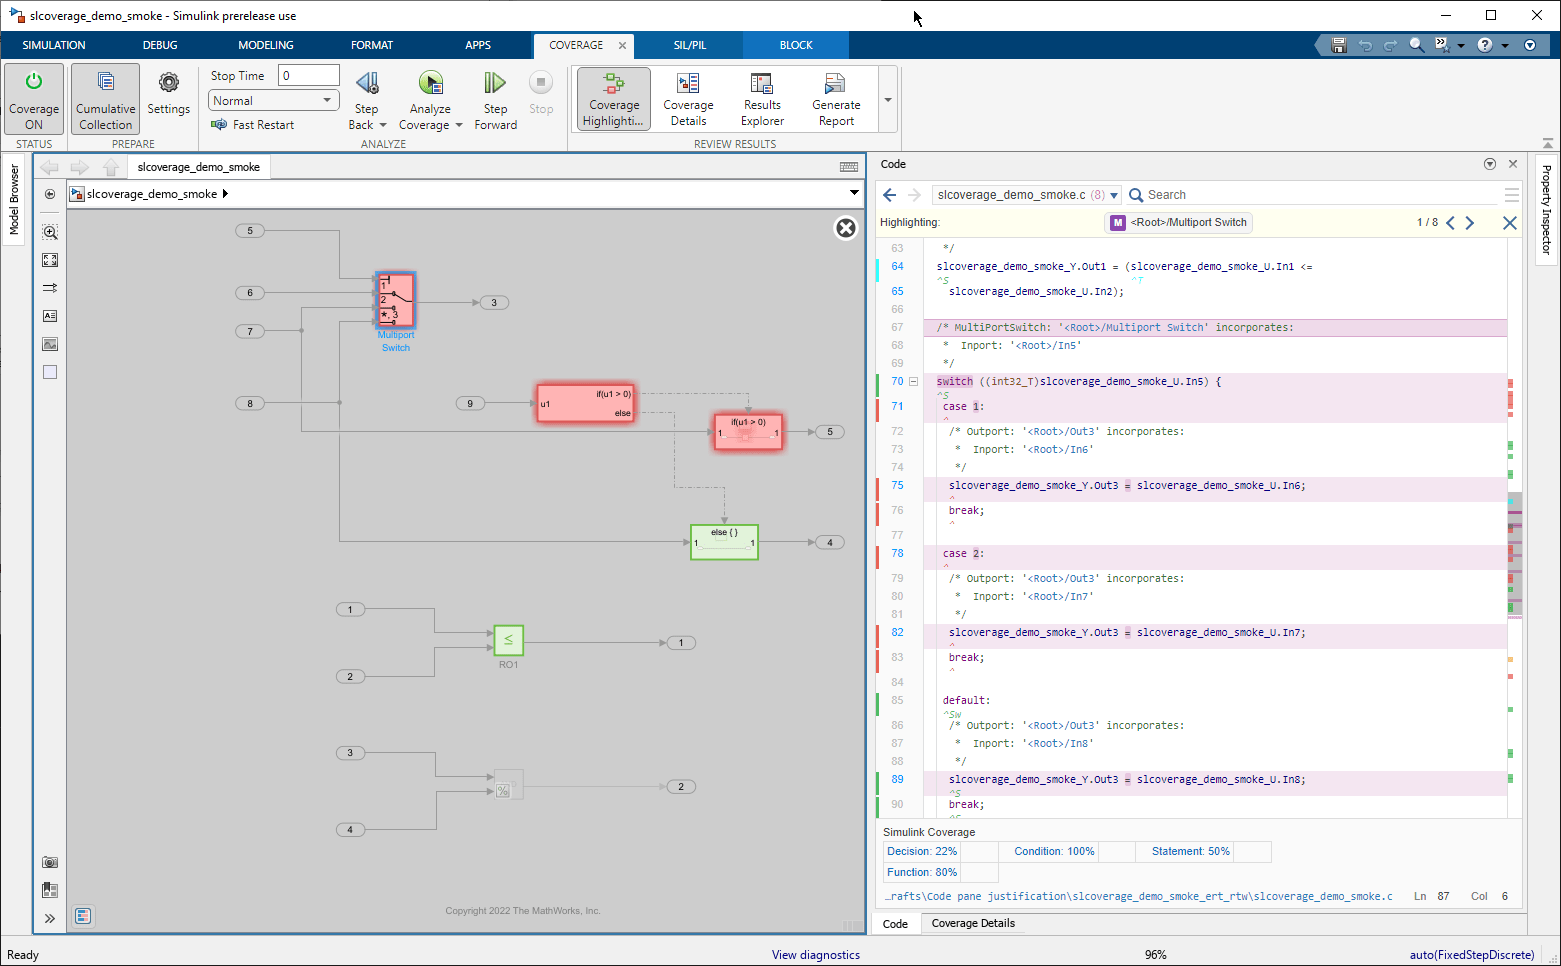
The annotations in the code pane point at a specific coverage objective, and the color of each annotation indicates the completeness of the coverage analysis. On line 35, the red line to the left of the line number indicates that the objective on line 35 has 0% coverage. In this case, there is only one coverage objective on the line, but the line color gives a quick summary of all coverage objectives on that line. Point your cursor at the carat underneath the start of the function name to view a tooltip with more information.

The tooltip clarifies that the missing coverage belongs to the function call metric, and the function on line 35 was not called during code execution.
On line 50, the green line indicates that the objective highlighted has 100% coverage. For objectives with complete or partial coverage, the carat annotations have additional text to indicate which objectives are satisfied. For example, line 50 displays ^Fcn. Point your cursor at this annotation to view another tooltip with additional information.

The tooltip indicates that the function on line 50 is called during code execution and has complete function call coverage.
Similarly, ^S indicates statement coverage.

^Sw indicates switch label, or the default case of a switch statement.

If a coverage metric contains more than one possible outcome, the annotation shows all satisfied outcomes. For example, a condition with partial coverage shows a yellow ^t or ^f depending on whether the true or false case is satisfied, respectively. If both outcomes are satisfied, the annotation shows a green ^tf. The tooltip shows all outcomes, even if they are not satisfied. Scroll to line 64 and point your cursor to the annotation ^t.

The annotation and tooltip indicate that the true outcome of the condition is satisfied, but the false case did not occur during code execution.
Justify A Coverage Outcome
Suppose the false case of the condition slcoverage_demo_smoke_U.In1 <= slcoverage_demo_smoke_U.In2 on line 64 is not relevant in this test. You can justify this outcome from the Code pane by clicking the Not Covered link in the annotation tooltip.

When you click the tooltip link, the Coverage Results Explorer opens to the Filter Editor pane and creates a new rule that justifies the outcome you selected. In the Filter Editor pane, enter codePaneFilter into the Name field. Under the filter rules, set Rationale to not relevant. Click Apply, and in the Save dialog, click Save. When you save the filter and return to the model, at the bottom of Coverage Details, click Code to return to the Code pane.
On line 64, the yellow annotation ^t changes to cyan to indicate that the true case is satisfied and the false case is justified. Additionally, the yellow line to the left of the line number changes to cyan to indicate that the coverage outcome on that line contains a justification filter rule.

When you filter an outcome using the tooltip link in the Code pane, Simulink Coverage creates a justification rule. You cannot change this to an exclusion rule. To create an exclusion filter rule, use the Justify or Exclude links in the Coverage Details pane.
Exclude A Coverage Outcome
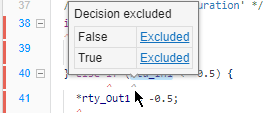
At the bottom of the Code pane, click Coverage Details. Scroll section 2.2 Decision rtu_In1 < -0.5 (line 40). Click Justify or Exclude. If a filter selection dialog window appears, select the same filter, codePaneFilter that you created.
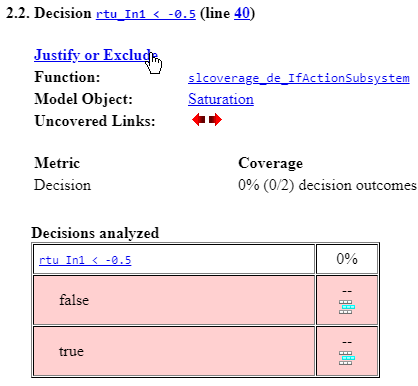
The Filter Editor pane of the Coverage Results Explorer opens and creates a new exclusion rule in the filter you created earlier.
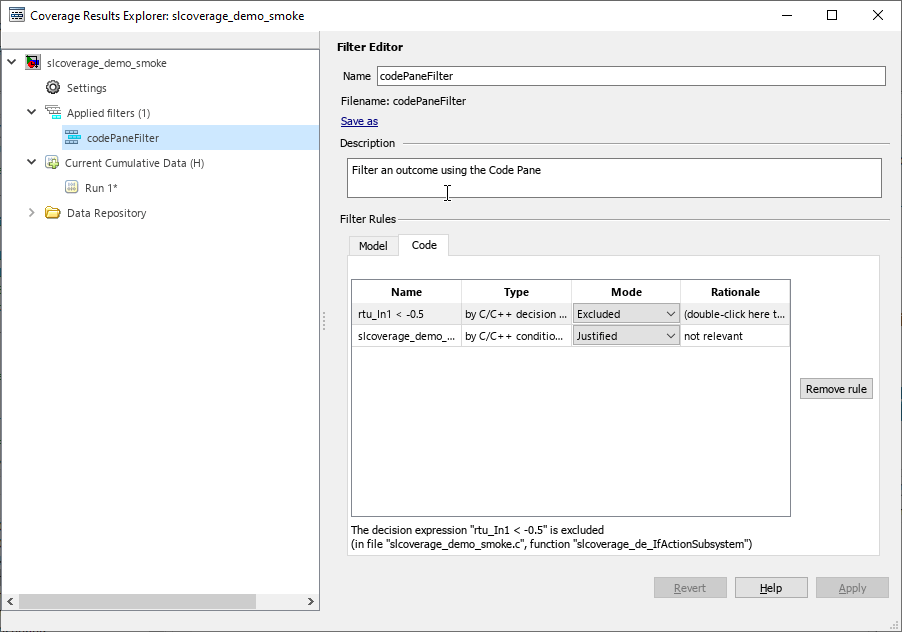
In the model, at the bottom of the Coverage Details pane, click Code. On line 40, the gray carat points to the excluded coverage objective.
View Multiple Outcomes on a Single Line of Code
Open the slcoverage_demo_smoke2.slx model.

Open the SIL/PIL app by clicking SIL/PIL Manager in the Apps tab. Click Run SIL/PIL.
In the Code pane, scroll to line 79. This line contains two annotations stacked on one another, because the line of code contains a decision composed of two conditions. The annotation for the decision displays next to the first condition.

The uppercase yellow ^F refers to the decision slcoverage_demo_smoke2_U.In3 && slcoverage_demo_smoke2_U.In4, and the lowercase yellow ^f refers to the first condition in the decision, slcoverage_demo_smoke2_U.In3. Point to the uppercase ^F to view the decision tooltip.

You can see that the false case is satisfied, but the true case of the decision did not occur during code execution. If you also look at the condition tooltip, you see the same results. Now, point to the carat on line 80 to view the tooltip for the second condition, slcoverage_demo_smoke2_U.In4.

This tooltip is consistent with the red bar at the left of the line number, which indicates that this condition receives 0% condition coverage. The reason this condition is not evaluated is due to logical short circuiting. Because the first condition is false each time the code executes and the decision is an && operator, the decision is false, so the second condition does not need to be evaluated.
Filter Multiple Outcomes on a Single Line of Code
In the tooltip for the condition ^f, click the link Not covered. In the Filter Editor pane of the Coverage Results Explorer, set Name to codePaneFilter2 and set Rationale to Not relevant. Click Apply. In the dialog that appears, click Save. At the bottom of Coverage Details, click Code. At line 79, the yellow bar to the left of the line number remains yellow because there is still unsatisfied and unjustified coverage on this line, but the yellow ^f changes to cyan.

Limitations
Displaying and filtering modified condition decision coverage (MCDC) outcomes is not supported from the Code pane. To view and filter MCDC outcomes for code coverage, use the Coverage Details pane or the coverage report.
Creating and applying exclusion rules is not supported from the Code pane, but you can view exclusions rules that you apply using the Coverage Details pane or by loading a filter using the Coverage Results Explorer.
