PEM Electrolysis System
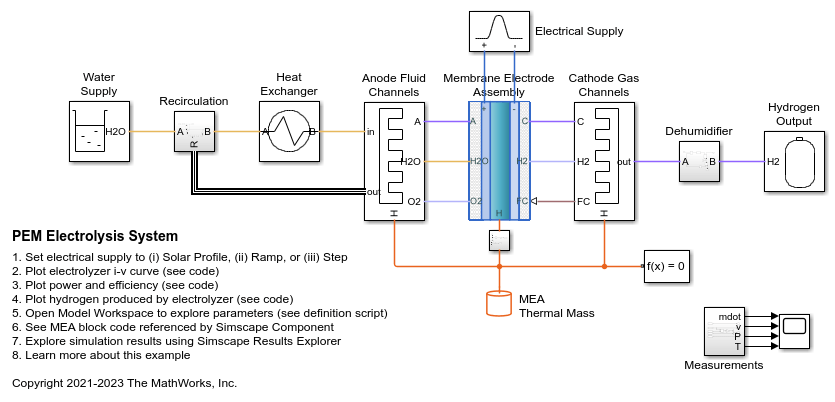
This example shows how to model a proton exchange membrane (PEM) water electrolyzer with a custom Simscape™ block. The PEM electrolyzer consumes electrical power to split water into hydrogen and oxygen. The custom block represents the membrane electrode assembly (MEA) and is connected to a thermal liquid network and two separate moist air networks: the thermal liquid network models the water supply, the anode moist air network models the oxygen flow, and the cathode moist air network models the hydrogen flow.
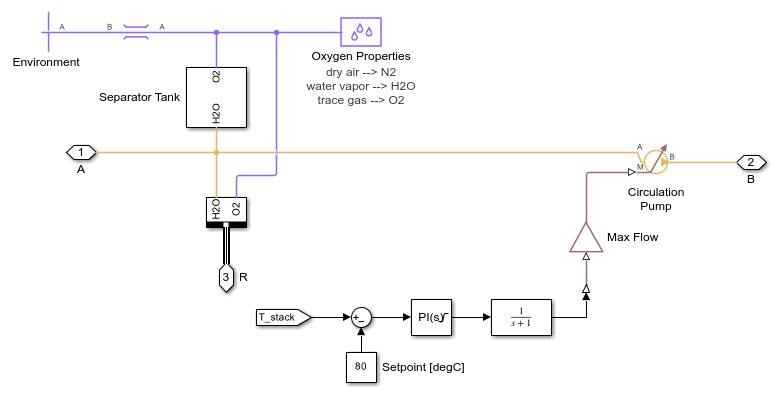
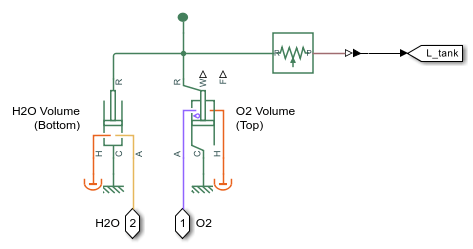
The circulation pump provides a continuous flow of water to the anode side of the electrolyzer. Consumed water is removed from the thermal liquid network and excess water is recirculated. Oxygen produced at the anode is carried away by the excess water flow; it is modeled separately by the anode moist air network. The separator tank models the balance of water and oxygen in the return flow before the oxygen is vented. The supply pump replenishes the system with fresh water.
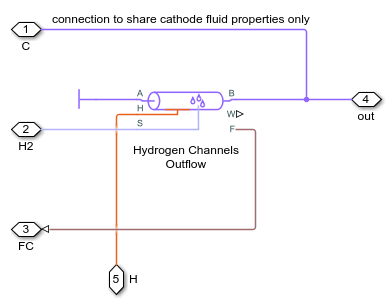
Hydrogen produced at the cathode side along with any water that has been transported across the MEA is modeled by the cathode moist air network. The dehumidifier removes the unwanted water vapor from the hydrogen. A pressure regulator valve maintains a pressure of 3 MPa at the cathode in comparison to atmospheric pressure at the anode. The differential pressure across the MEA results in water transport due to hydraulic pressure that helps counteract the electro-osmosis drag and reduces the amount of water at the cathode side.
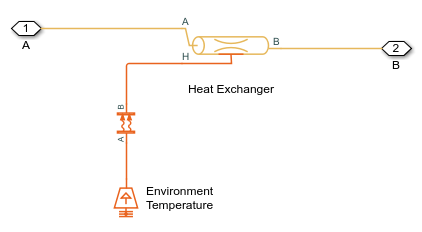
Unlike a fuel cell stack, a separate cooling network is not needed. Heat dissipated by the electrolyzer is carried away by the excess water and then rejected to the environment via the heat exchanger. The recirculating water is controlled to maintain a temperature of 80 degC in the electrolylzer.
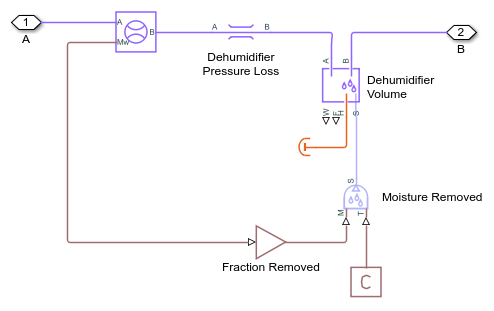
The custom MEA block is implemented in the Simscape code Electrolyzer.ssc. The thermal liquid port H2O is used to remove water from the thermal liquid network. The produced H2 and O2 and the transported H2O are added to the two moist air networks using Controlled Trace Gas Source (MA) and Controlled Moisture Source (MA) blocks. The excess heat is sent through the thermal port H to the connected Thermal Mass block. Refer to the comments in the code for additional details on the implementation.
See also the PEM Fuel Cell System example.
References:
Liso, Vincenzo, et al. "Modelling and experimental analysis of a polymer electrolyte membrane water electrolysis cell at different operating temperatures." Energies 11.12 (2018): 3273.
Mo, Jingke, et al. "Thin liquid/gas diffusion layers for high-efficiency hydrogen production from water splitting." Applied Energy 177 (2016): 817-822.
Model
Anode Fluid Channels Subsystem

Cathode Gas Channels Subsystem
Dehumidifier Subsystem
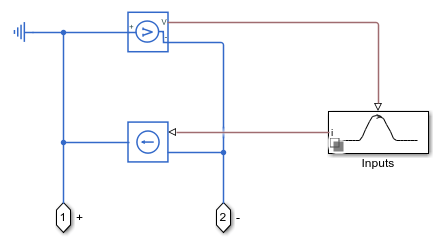
Electrical Supply Subsystem
Heat Exchanger Subsystem
Hydrogen Output Subsystem

Recirculation Subsystem
Separator Tank Subsystem
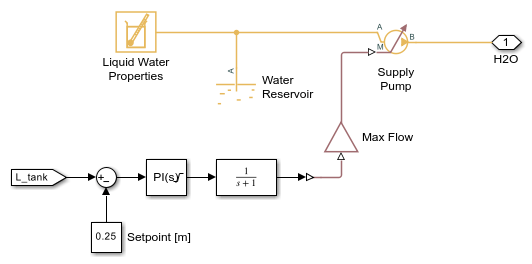
Water Supply Subsystem
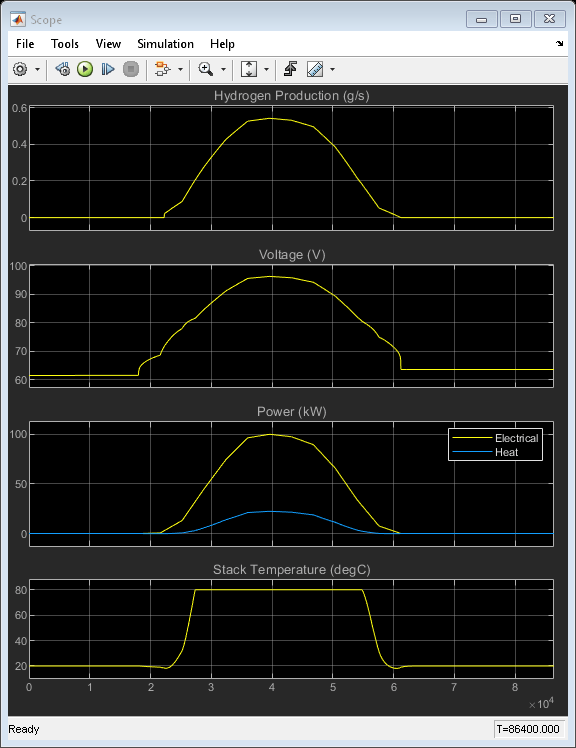
Simulation Results from Scopes
Simulation Results from Simscape Logging
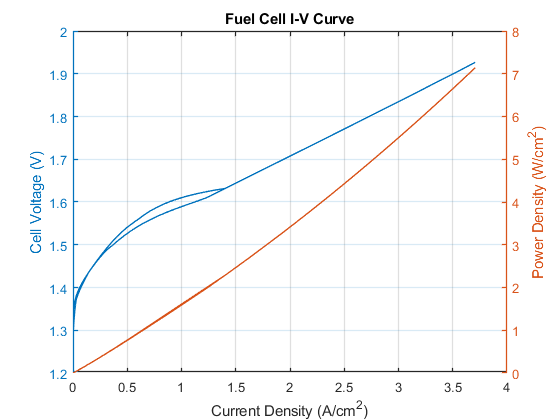
This plot shows the current-voltage (i-v) curve and the power consumed by a cell in the stack. As the current ramps up, an initial rise in voltage occurs due to electrode activation losses, followed by a gradual increase in voltage due to Ohmic resistances. The cell voltage is about 1.71 V at a current density of 2 A/cm^2.
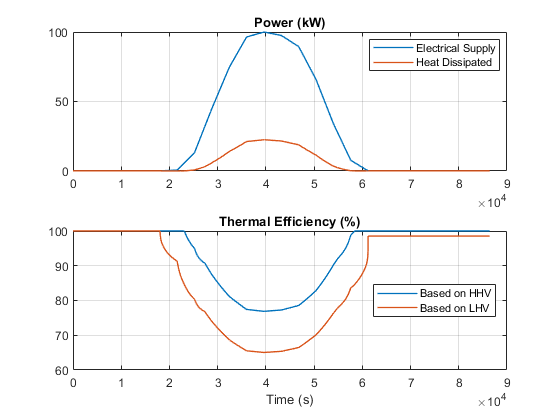
This plot shows the electrical power consumed by the electrolyzer. The electrical power is greater than the power needed to produce hydrogen due to various losses. The difference is the heat dissipated.
This plot also shows the thermal efficiency of the electrolyzer, which indicates the fraction of the electrical power used to generate hydrogen based on hydrogen's heating value. This electrolyzer is about 87% efficient at a current density of 2 A/cm^2.
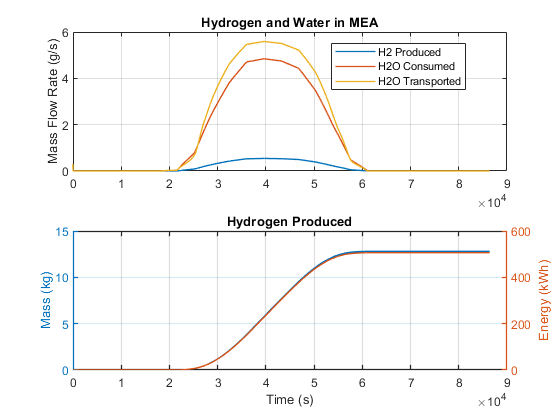
This plot shows the rate of hydrogen produced, the rate of water consumed at the anode, as well as the rate of water transported to the cathode due to diffusion, electro-osmosis drag, and hydraulic pressure difference. As a result, a dehumidification step is necessary to produce hydrogen at the desired purity.
This plot also shows the total mass of hydrogen produced and the equivalent energy based on its higher heating value. This provides an indication of the amount of energy available if the hydrogen is used to generate power in a fuel cell.
