Cuboids, Cylinders, and Spheres
This example shows how to create 3-D geometries formed by one or more cubic, cylindrical, and spherical cells by using the multicuboid, multicylinder, and multisphere functions, respectively. With these functions, you can create stacked or nested geometries. You also can create geometries where some cells are empty; for example, hollow cylinders, cubes, or spheres.
All cells in a geometry must be of the same type: either cuboids, or cylinders, or spheres. These functions do not combine cells of different types in one geometry.
Single Sphere
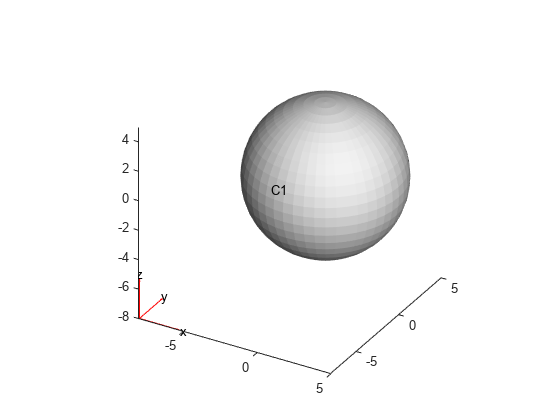
Create a geometry that consists of a single sphere and plot it.
Use the multisphere function to create a single sphere. The resulting geometry consists of one cell.
gm = multisphere(5)
gm =
  DiscreteGeometry with properties:

       NumCells: 1
       NumFaces: 1
       NumEdges: 0
    NumVertices: 0
       Vertices: []
Plot the geometry.
pdegplot(gm,CellLabels="on")
Nested Cuboids of Same Height
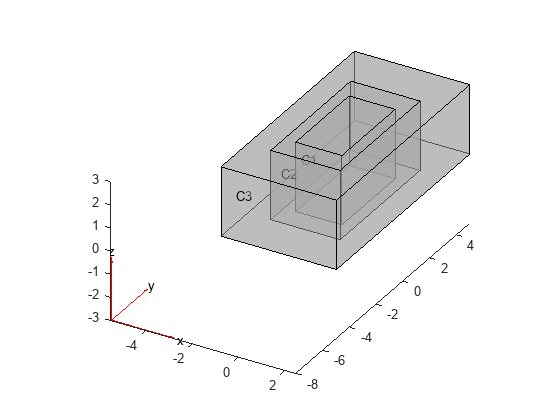
Create a geometry that consists of three nested cuboids of the same height and plot it.
Create the geometry by using the multicuboid function. The resulting geometry consists of three cells.
gm = multicuboid([2 3 5],[4 6 10],3)
gm =
  DiscreteGeometry with properties:

       NumCells: 3
       NumFaces: 18
       NumEdges: 36
    NumVertices: 24
       Vertices: [24x3 double]
Plot the geometry.
pdegplot(gm,CellLabels="on",FaceAlpha=0.5)
Stacked Cylinders
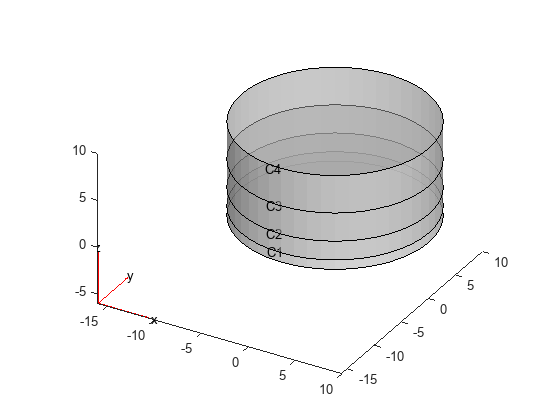
Create a geometry that consists of three stacked cylinders and plot it.
Create the geometry by using the multicylinder function with the ZOffset argument. The resulting geometry consists of four cells stacked on top of each other.
gm = multicylinder(10,[1 2 3 4],ZOffset=[0 1 3 6])
gm =
  DiscreteGeometry with properties:

       NumCells: 4
       NumFaces: 9
       NumEdges: 5
    NumVertices: 5
       Vertices: [5x3 double]
Plot the geometry.
pdegplot(gm,CellLabels="on",FaceAlpha=0.5)
Hollow Cylinder
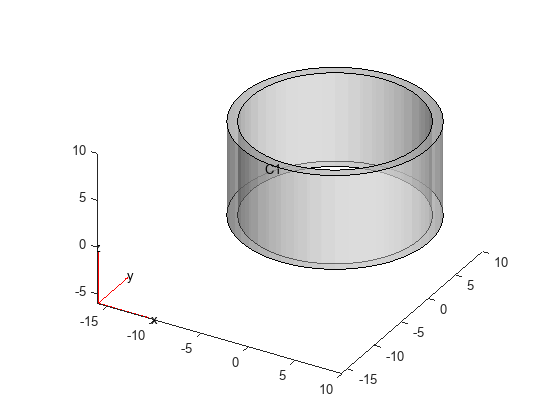
Create a hollow cylinder and plot it.
Create a hollow cylinder by using the multicylinder function with the Void argument. The resulting geometry consists of one cell.
gm = multicylinder([9 10],10,Void=[true,false])
gm =
  DiscreteGeometry with properties:

       NumCells: 1
       NumFaces: 4
       NumEdges: 4
    NumVertices: 4
       Vertices: [4x3 double]
Plot the geometry.
pdegplot(gm,CellLabels="on",FaceAlpha=0.5)
