uihtml
Create HTML UI component
Description
h = uihtml creates an HTML UI component in a new figure and returns
the HTML UI component object. MATLAB® calls the uifigure function to create the
figure.
With the uihtml function, you can embed HTML, JavaScript®, or CSS content in your app and interface with third-party libraries to
display content like widgets or data visualizations. All supporting files (including HTML,
JavaScript, CSS, images) must be saved in a location that your local file system can
access.
h = uihtml( creates an HTML UI
component in the specified parent container. The parent can be a parent)Figure
object created with the uifigure function or one of its child
containers.
h = uihtml(___,
specifies HTML UI component properties using one or more name-value arguments. For example,
Name,Value)uihtml("Position",[230 60 40 150]) creates an HTML UI component with
the specified location and size. Use this option with any of the input argument combinations
in the previous syntaxes.
Examples
Display Formatted Text
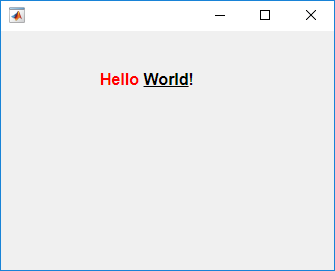
Create an HTML component and display formatted text in it using HTML markup.
fig = uifigure('Position',[561 497 333 239]);
h = uihtml(fig);
h.HTMLSource = '<p style="font-family:arial;"><b><span style="color:red;">Hello</span> <u>World</u>!</b></p>';
Embed Audio and Video Using HTML File
Create an HTML file to embed audio and video elements in your app and reference media source files.
First, create an empty HTML UI component in a figure.
fig = uifigure;
fig.Position = [500 500 380 445];

h = uihtml(fig);
h.Position = [10 10 360 420];
Then, create an HTML file called audio_videoplayers.html. In the file, add audio and video elements and specify their file sources relative to the path of the HTML file. In this example, the media files are in the same directory as the HTML file.
A good practice is to specify multiple file sources for each element because not all contexts support the same file types. For example, MP4 videos are not supported for HTML components in the MATLAB Desktop but are supported in MATLAB Online™. In the video element, specify an OGA file as the first video for the app to try to play. Then, specify an MP4 file as a fallback if the first file is not supported.
<!DOCTYPE html>
<html>
	<body style="background-color:white;font-family:arial;">
		<p style="padding-left:20px">
		Play audio file:
		</p>

		<audio controls style="padding-left:20px">
			<source src="./handel_audio.wav" type="audio/wav">
			<source src="./handel_audio.oga" type="audio/ogg">
			Your browser does not support the audio tag.
		</audio>

		<p style="padding-left:20px">
		Play video file:
		</p>

		<video width="320" height="240" controls style="padding-left:20px">
                        <source src="./xylophone_video.oga" type="video/ogg">
			<source src="./xylophone_video.mp4" type="video/mp4">
			Your browser does not support the video tag.
		</video>

	</body>
</html>
Now, embed the HTML file in your app by setting the HTMLSource property to the full path to the file.
h.HTMLSource = fullfile(pwd,'audio_videoplayers.html');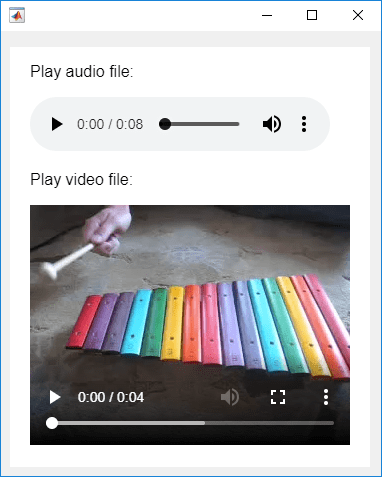
Code JavaScript Response to Data Change in MATLAB
Create an htmlComponent JavaScript® object that displays the data that is set on an HTML UI component in MATLAB®.
First, create an empty HTML UI component and position it within a figure.
fig = uifigure;
fig.Position = [500 500 490 180];

h = uihtml(fig);
h.Position = [20 20 450 130];
Then, create an HTML file called displayDataFromMATLAB.html. In the file,
Use a
styletag to define internal CSS styles for the<div>elements that display text.Write a
setupfunction inside of a<script>tag to connect your JavaScript object, calledhtmlComponent, to the HTML UI component you created in MATLAB.Add an event listener within the
setupfunction. The event listener listens for"DataChanged"events on thehtmlComponentJavaScript object and creates a listener callback function. When a"DataChanged"event occurs, the listener callback function updates the"dataDisplay"<div> elementwith the value that is set to theDataproperty in MATLAB.
<!DOCTYPE html>
<html>
<head>
<style>
#prompt {
  font-family: sans-serif;
  text-align:center;
  border-radius: 5px;
  background-color: lightblue;
  padding: 20px;
}

#dataDisplay {
  border-radius: 5px;
  height: 10vh;
  padding: 12px 20px;
}
</style>

<script type="text/javascript">

        function setup(htmlComponent) {

            htmlComponent.addEventListener("DataChanged", function(event) {
            document.getElementById("dataDisplay").innerHTML = htmlComponent.Data;
            });
        }
</script>
</head>

<body>
     <div id="prompt">

	<span><label for="prompt"><strong>Data from MATLAB will display here:</strong></label></span>
	<br/><br/>
	<div id ="dataDisplay">
	Please set data in MATLAB...
	</div>

     </div>
</body>

</html>
Now, in MATLAB, set the value of the HTMLSource property to the path to the HTML file.
h.HTMLSource = fullfile(pwd,'displayDataFromMATLAB.html');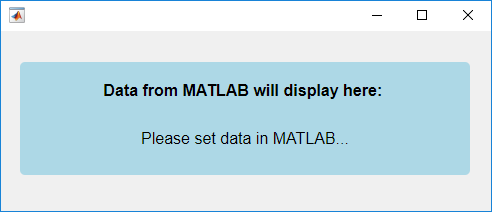
Set the value of the Data property for the HTML UI component. Notice how the htmlComponent JavaScript object updates in your HTML UI component.
h.Data = "Hello World!";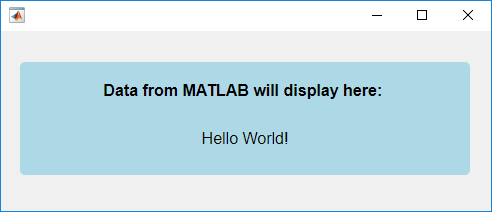
Code MATLAB Response to Data Change in JavaScript
Create a JavaScript
htmlComponent object that shows a button and a progress bar, and
display the current progress in the MATLAB Command Window whenever the progress changes.
First, create an empty HTML UI component and position it within a figure.
fig = uifigure("Position",[500 500 350 150]);
h = uihtml(fig,"Position",[50 40 250 70]);
Then, create an HTML file named progressBar.html. In the
file:
Use a
<style>tag to define internal CSS styles for a button and a progress bar element.Write a
setupfunction inside of a<script>tag to connect your JavaScript object, namedhtmlComponent, to the HTML UI component you created in MATLAB.Add an event listener within the
setupfunction. The event listener listens for"click"events on the button and creates a listener callback function. When a user clicks the Next button, the listener callback function updates the progress bar and sets theDataproperty of thehtmlComponentto the new progress value.
<!DOCTYPE html>
<html>
<head>
<style>
body {
    text-align: center;
}
button {
    width: 43px;
    height: 20px;
}
progress {
    width: 90%;
    height: 20px;
}
</style>

<script type="text/javascript">
    function setup(htmlComponent) {
        let btn = document.getElementById("nextButton");
        htmlComponent.Data = 0;
        btn.addEventListener("click", function(event) {
            let progress = htmlComponent.Data;
            progress = Math.min(progress+25,100);
            document.getElementById("progressBar").value = progress;
            htmlComponent.Data = progress;
        });
    }
</script>
</head>

<body>
    <button id="nextButton">Next</button>
    <br>
    <progress id="progressBar" value="0" max="100"></progress>
</body>
</html>
In MATLAB, set the value of the HTMLSource property to the path
of the HTML file. Create a DataChangedFcn callback function that
displays the updated progress whenever the Data property
changes.
h.HTMLSource = "progressBar.html";
h.DataChangedFcn = @(src,event)disp(event.Data);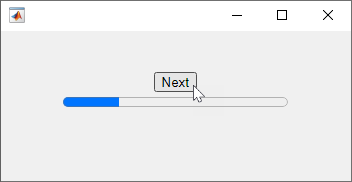
Click the Next button to update the progress bar
and change the Data property. The progress displays in the
MATLAB Command Window.
Send Event from JavaScript to MATLAB
Since R2023a
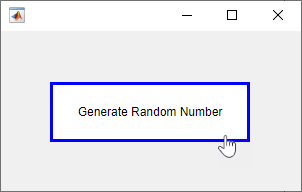
Create a JavaScript
htmlComponent object that generates a random number when a user clicks
a button, and display the number in MATLAB.
First, create a new script named myRandomNum.m. In the script,
create an empty HTML UI component and position it within a figure.
fig = uifigure("Position",[100 100 300 160]);
h = uihtml(fig,"Position",[50 50 200 60]);
Then, create an HTML file named generateJSRandomNumber.html. In
the file:
Use a
<style>tag to define internal CSS styles for a button element.Write a
setupfunction inside of a<script>tag to connect your JavaScript object, namedhtmlComponent, to the HTML UI component you created in MATLAB.Add an event listener within the
setupfunction that listens for"click"events on the button. When a user clicks the button, first generate a random number, and then send an event to notify MATLAB of the click. Pass in the random number as event data so that you can access the number in MATLAB.
<!DOCTYPE html>
<html>
<head>
<style>
body {
  height: 100%;
  text-align: center
}

button {
  width: 100%;
  height: 100%;
  background-color: white;
  color: black;
  border: 3px solid blue;
  font-size: 12px;
  cursor: pointer;
}
</style>

<script type="text/javascript">
   function setup(htmlComponent) {
       let button = document.getElementById("Button");
       button.addEventListener("click", function(event) {
           let num = Math.floor(Math.random() * 100) + 1;
           htmlComponent.sendEventToMATLAB("ButtonClicked",num);
       });
   }
</script>
</head>

<body>
   <button id="Button">Generate Random Number</button>
</body>
</html>
In MATLAB, in the myRandomNum.m script, set the value of the
HTMLSource property to the path of the HTML file. Create an
HTMLEventReceivedFcn callback function that displays the generated
random number in the Command Window.
h.HTMLSource = "generateJSRandomNumber.html";
h.HTMLEventReceivedFcn = @displayNumber;

function displayNumber(src,event)
name = event.HTMLEventName;
if strcmp(name,'ButtonClicked')
    number = event.HTMLEventData;
    disp(number);
end
end
Run the script and click the button to generate and display the random number in the MATLAB Command Window.
Send Event from MATLAB to JavaScript
Since R2023a
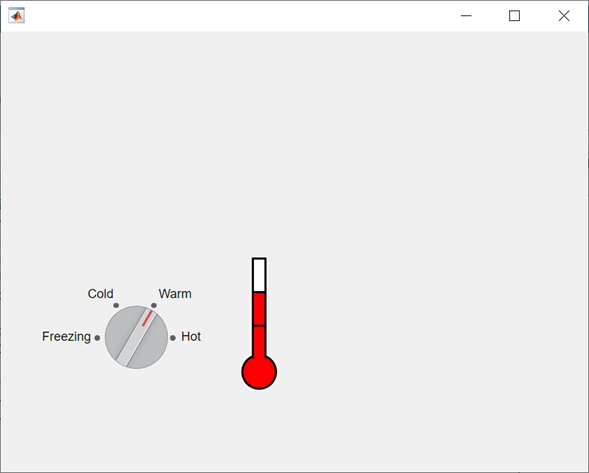
Create a JavaScript
htmlComponent object that updates HTML element styling when a user
interacts with a MATLAB knob component.
First, create a new script named myTemperature.m. In the script,
create a knob UI component and an empty HTML UI component in a UI figure.
fig = uifigure;
k = uiknob(fig,"discrete", ...
    "Items",["Freezing","Cold","Warm","Hot"], ...
    "ItemsData",[0 1 2 3], ...
    "Value",0);
h = uihtml(fig,"Position",[230 60 40 150]);
Then, create an HTML file named thermometer.html. In the
file:
Use a
<style>tag to define internal CSS styles for the parts of a thermometer.Write a
setupfunction inside of a<script>tag to connect your JavaScript object, namedhtmlComponent, to the HTML UI component you created in MATLAB.Add an event listener within the
setupfunction that listens for events from MATLAB named"TemperatureChanged". When thehtmlComponentobject is notified that the temperature has changed, query the event data to get the new temperature. Then, adjust the styling on the thermometer to reflect the new temperature.
<!DOCTYPE html>
<html>
<head>
<style>
.bulb {
    width: 30px;
    height: 30px;
    border: 2px solid;
    border-radius: 50%;
    background-color: red;
}

.stem {
    width: 10px;
    height: 30px;
    border-top: 2px solid;
    border-left: 2px solid;
    border-right: 2px solid;
    position: relative;
    left: 10px;
    top: 4px;
    background-color: white;
}

.stem.hot {
    background-color: red;
}
</style>

<script type="text/javascript">
    function setup(htmlComponent) {
        htmlComponent.addEventListener("TemperatureChanged", function(event) {
            let stem1 = document.getElementById("Stem1");
            let stem2 = document.getElementById("Stem2");
            let stem3 = document.getElementById("Stem3");
            (event.Data > 0) ? stem1.classList.add("hot") : stem1.classList.remove("hot");
            (event.Data > 1) ? stem2.classList.add("hot") : stem2.classList.remove("hot");
            (event.Data > 2) ? stem3.classList.add("hot") : stem3.classList.remove("hot");
        });
    }
</script>
</head>

<body>
    <div id="Stem3" class="stem"></div>
    <div id="Stem2" class="stem"></div>
    <div id="Stem1" class="stem"></div>
    <div id="Bulb" class="bulb"></div>
</body>
</html>
In MATLAB, in the script, write code to communicate with the HTML source:
Set the value of the
HTMLSourceproperty of the HTML UI component to the path of the HTML file.Write a
ValueChangedFcncallback function for the knob that sends an event named"TemperatureChanged"to the HTML source when the temperature changes. Pass the new temperature value as event data.
h.HTMLSource = "thermometer.html";
k.ValueChangedFcn = @(src,event) handleKnobValueChanged(src,event,h);

function handleKnobValueChanged(src,event,h)
val = src.Value;
sendEventToHTMLSource(h,"TemperatureChanged",val);
end
Run the script and interact with the knob to update the thermometer.
Share Multiple Fields of Data Between MATLAB and JavaScript
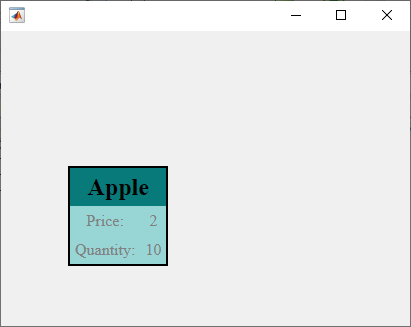
Create an HTML UI component that displays data with multiple fields.
Create an item card component that lists an item name, price, and quantity. Design the HTML UI component to take in the item data as a struct in MATLAB. First, check how struct data is encoded when the data is transferred from MATLAB to JavaScript by using the jsonencode function.
matlabData = struct("ItemName","Apple","Price",2,"Quantity",10);
jsonencode(matlabData)
ans =
'{"ItemName":"Apple","Price":2,"Quantity":10}'
For more information about how HTML components transfer data between MATLAB and JavaScript, see Create HTML Content in Apps.
Next, create an HTML source file called itemCard.html that creates and styles the item card HTML component. In the file:
Use a
<style>tag to define internal CSS styles for an item card.Write a
setupfunction inside of a<script>tag to detect when theDataproperty of the MATLAB HTML UI component object changes, and then access theDataproperty of the JavaScripthtmlComponentobject. The data is encoded as a JavaScript object with multiple properties. Access these properties to update the content of the HTML component.Use a
<body>tag to create the main HTML document content.
<!DOCTYPE html>
<html>
<head>
<style>
    table {
        border: 2px solid;
        border-spacing: 0;
        text-align: center;
        position: absolute;
        width: 100%;
        height: 100%;
        margin: 0px;
        padding: 0px;
    }
    th {
        background-color: #097A7A;
        color: black;
        font-size: 24px;
        height: 40%;
    }
    tr {
        background-color: #98D6D6;
        color: gray;
        height: 30%;
    }
    td {
        padding: 5px;
    }
</style>

<script type="text/javascript">
    function setup(htmlComponent) {
        htmlComponent.addEventListener("DataChanged", function(event) {
            let table = document.getElementById("itemCard");
            table.rows[0].cells[0].innerHTML = htmlComponent.Data.ItemName;
            table.rows[1].cells[1].innerHTML = htmlComponent.Data.Price;
            table.rows[2].cells[1].innerHTML = htmlComponent.Data.Quantity;
        });
    }
</script>
</head>

<body>
    <div>
	<table id="itemCard">
            <tr>
                <th colspan="2">Item</th>
            </tr>
            <tr>
                <td>Price:</td>
                <td></td>
            </tr>
            <tr>
                <td>Quantity:</td>
                <td></td>
            </tr>
        </table>
    </div>
</body>
</html>
Create an HTML component in a UI figure. Specify itemCard.html as the HTML source and an item data struct as the component data.
itemData = struct("ItemName","Apple","Price",2,"Quantity",10);
fig = uifigure;
c = uihtml(fig,"HTMLSource","itemCard.html","Data",itemData);
Input Arguments
parent — Parent container
Figure object (default) | Tab object | Panel object | ButtonGroup object | GridLayout object
Parent container, specified as a Figure object created using the uifigure function or one of its child
containers: Tab, Panel, ButtonGroup, or GridLayout. If you do not specify a parent container, MATLAB calls the uifigure function to create a new Figure object that serves as the parent container.
Name-Value Arguments
Specify optional pairs of arguments as
Name1=Value1,...,NameN=ValueN, where Name is
the argument name and Value is the corresponding value.
Name-value arguments must appear after other arguments, but the order of the
pairs does not matter.
Example: h =
uihtml(uifigure,HTMLSource="C:\Work\expenses.html");
Before R2021a, use commas to separate each name and value, and enclose
Name in quotes.
Example: h =
uihtml(uifigure,"HTMLSource","C:\Work\expenses.html");
Note
The properties listed here are only a subset. For a complete list, see HTML.
HTMLSource — HTML markup or file
'' (default) | string scalar | character vector
HTML markup or file, specified as a character vector or string scalar that contains either
HTML markup or the path to an HTML file. All HTML markup and files must be well formed.
If the specified character vector or string scalar ends with .html,
then it is assumed to be the path to an HTML file.
This table gives more information about each of the options.
| HTML Source | Example | Details |
|---|---|---|
| HTML markup | h = uihtml("HTMLSource","<p>This is <span
style="color:red">red</span>
text.</p>") | Specify HTML markup if your content consists only of simple, formatted text, without any JavaScript code. When you embed HTML markup, you do
not need to specify |
| HTML file | h =
uihtml("HTMLSource","CustomCharts.html") | Specify an HTML file if your HTML content contains any of these attributes:
The HTML file must be located in a place
that your local file system can access. Any supporting files must be
located in the folder that contains the HTML file you specify for
the |
Data — MATLAB data
any MATLAB data type
MATLAB data, specified as any MATLAB data type. Use this argument when the value of
HTMLSource is the path to an HTML file defining a JavaScript object. Then, this data can be synchronized between the MATLAB HTML UI component and the JavaScript object.
To synchronize the value of the Data property between MATLAB and the third-party content that you are embedding in your app, create a
setup function in an HTML file that connects a JavaScript object called htmlComponent to the HTML UI component in
MATLAB. Then, set the HTMLSource property value to the path
to the file.
Changes in the value of the Data property trigger callback events
in only one direction. Specifically,
When the
Dataproperty is set in MATLAB, theDataproperty of thehtmlComponentJavaScript object also updates and triggers JavaScript event listeners of the'DataChanged'event.When
htmlComponent.Datais set in JavaScript, theDataproperty of the HTML UI component in MATLAB also updates and triggers theDataChangedFcncallback.
If you have data like nested cell arrays, arrays of structures, or MATLAB table array data, you might need more information about how data is
converted between MATLAB and JavaScript. When the Data property of an HTML UI component is
set in MATLAB, the data is converted using the jsonencode function,
synchronized with JavaScript, parsed using JSON.parse(), and finally set to the Data property of
the htmlComponent
JavaScript object. Conversions happen in the opposite direction as well by way of
JSON.stringify() and the jsondecode function. The
Data property is the only property that synchronizes with
JavaScript.
Refer to the jsonencode function for more information
about the data types it supports. If the jsonencode function does
not support your data type, then use a data type conversion function, like num2str, to convert your data to a supported type. Then, set it as the
value of the Data property.
For more information about how to write an HTML file that enables data synchronization
and the properties of the htmlComponent
JavaScript object, see Create HTML Content in Apps.
DataChangedFcn — Callback when data changes
'' (default) | function handle | cell array | character vector
Callback when data changes, specified as one of these values:
Function handle.
Cell array in which the first element is a function handle. Subsequent elements in the cell array are the arguments to pass to the callback function.
Character vector containing a valid MATLAB expression (not recommended). MATLAB evaluates this expression in the base workspace.
When the value of the Data property changes in the
htmlComponent
JavaScript object, the Data property of the MATLAB HTML UI component is updated, and this callback executes.
This callback function can access specific information about changes in data in the JavaScript object. MATLAB passes the information in a DataChangedData object as the second argument to your callback function. In App Designer, the argument is called event. You can query the DataChangedData object properties using dot notation. For example, event.PreviousData returns the previous value of Data before it was last updated or changed. The DataChangedData object is not available to callback functions specified as character vectors.
This table lists the properties of the DataChangedData object.
| Property | Description |
|---|---|
Data | Most recent data resulting from the last DataChanged event |
PreviousData | Data before the last DataChanged event |
Source | MATLAB HTML UI component that executes the callback |
EventName | 'DataChanged' |
For more information about writing callbacks, see Callbacks in App Designer.
HTMLEventReceivedFcn — Callback when event is received from HTML source
'' (default) | function handle | cell array | string scalar | character vector
Since R2023a
Callback when an event is received from the HTML source, specified as one of these values:
Function handle.
Cell array in which the first element is a function handle. Subsequent elements in the cell array are the arguments to pass to the callback function.
String scalar or character vector containing a valid MATLAB expression (not recommended). MATLAB evaluates this expression in the base workspace.
This callback executes when an event is sent from JavaScript to MATLAB by calling the sendEventToMATLAB function on the
JavaScript
htmlComponent object. Use this callback to write MATLAB code to respond to user interaction or changes in the HTML component, such
as a click on a button HTML element. For more information, see Create HTML Content in Apps.
This callback function can access specific information about the event that the
JavaScript object sent. MATLAB passes the information in an HTMLEventReceivedData
object as the second argument to your callback function. In App Designer, the argument
is called event. Query the HTMLEventReceivedData
object properties using dot notation. For example,
event.HTMLEventName returns name of the event that was specified
by the JavaScript object. The HTMLEventReceivedData object is not
available to callback functions specified as string scalars or character vectors.
This table lists the properties of the HTMLEventReceivedData
object.
| Property | Description |
|---|---|
HTMLEventName | Name of the event as specified by the
sendEventToMATLAB function called in the
JavaScript code |
HTMLEventData | Event data as specified by the
sendEventToMATLAB function called in the
JavaScript code |
Source | MATLAB HTML UI component that executes the callback |
EventName | 'HTMLEventReceived' |
For more information about writing callbacks, see Create Callbacks for Apps Created Programmatically.
Position — Location and size of HTML UI component
[100 100 100 100] (default) | [left bottom width height]
Location and size of HTML UI component relative to the parent container, specified as
a four-element vector of the form [left bottom width height]. This
table describes each element in the vector.
| Element | Description |
|---|---|
left | Distance from the inner left edge of the parent container to the outer left edge of the HTML UI component |
bottom | Distance from the inner bottom edge of the parent container to the outer bottom edge of the HTML UI component |
width | Distance between the right and left outer edges of the HTML UI component |
height | Distance between the top and bottom outer edges of the HTML UI component |
The Position values are relative to the
drawable area of the parent container. The drawable area is
the area inside the borders of the container and does not include the area occupied by
decorations such as a menu bar or title.
All measurements are in pixel units.
Limitations
You cannot link to URL web resources or embed applications from external web pages using the
uihtmlfunction.HTML files that you specify for the
HTMLSourceproperty cannot access third-party JavaScript libraries by way of a Content Delivery Network (CDN). Save libraries in a location that your local file system can access.Common web file types, like JavaScript and CSS, can be referenced from the HTML file you specify for the
HTMLSourceproperty, but other web file types might not be supported.Any supporting files that your component code uses must be in the folder that contains the HTML file you specify for the
HTMLSourceproperty or in a subfolder of that folder.Content cannot overflow the bounds of the HTML UI component. If you are creating dynamic content, like pop-up widgets, make the size of your HTML UI component large enough to display the widget when the pop-up is in its opened state.
On MATLAB Desktop, certain HTML features, such as web plugins and access to webcams or microphones, are not supported.
You cannot set the
HTMLSourceproperty to an HTML file that has query parameters appended to its filename. As a workaround, set these parameters inhtmlComponent.Data.Hyperlinks with
matlab:operations are not supported.UI figure callbacks such as
WindowButtonDownFcnandWindowKeyPressFcndo not execute when an HTML UI component in the figure has focus.
More About
Potential Security Risks
Note
This list is not intended to be comprehensive. Consult external resources for additional risks and security considerations when interfacing with third-party libraries.
Applications that interface with third-party JavaScript libraries are potentially vulnerable to data or code injection attacks.
MATLAB features like the
evalfunction can increase the risk of injection attacks. As a countermeasure, validate untrusted input before using it in MATLAB.Any MATLAB function that processes code-like input (XML, JSON, SQL, etc.) is potentially vulnerable to code injection.
Applications that access the operating system using the MATLAB
system,dos, orunixfunctions might be vulnerable to code injection.
For information about how to reduce the potential risk to your deployed web apps, see Authoring Secure Web Apps (MATLAB Compiler).
Tips
If you are creating an HTML file to embed in your app, first verify that the static HTML renders properly in a browser. For more information, see Create HTML Content in Apps.
If you want to refresh the value of the
HTMLSourceproperty, use this workaround to save the original value ofHTMLSourceto a variable, resetHTMLSourceto an empty value and update the figure to clear its contents, and finally setHTMLSourceback to its original value.oldValue = h.HTMLSource; h.HTMLSource = ''; drawnow h.HTMLSource = oldValue;To use
uihtmlto display content in a supporting file, such as an image or video, put the file in a location that your local file system can access, reference it in an HTML file that includes the local content, and then set theHTMLSourceproperty to the HTML file.MATLAB figures created with the
uifigurefunction use the Chromium browser and run HTML5. New Chromium versions are released frequently and can vary between operating systems. Consult external Chromium resources for supported features and functionality. Take this factor into consideration if you plan to share your app or use it in different environments.Check external resources, like https://caniuse.com/, for the types of features that are supported across different desktop and web browsers.
bat365® does not promote any third-party libraries.
Version History
Introduced in R2019bR2023a: Send events between MATLAB and JavaScript
Send events associated with an HTML UI component to communicate between MATLAB and JavaScript when a specific action occurs.
In MATLAB, send events to JavaScript using the sendEventToHTMLSource function. React to events from JavaScript using the HTMLEventReceivedFcn property.
In the setup function in your HTML source file, send events to
MATLAB using the JavaScript
sendEventToMATLAB function. React to events from MATLAB using the JavaScript
addEventListener function.
For more information about events for HTML UI components, see Create HTML Content in Apps.
See Also
Functions
Properties
MATLAB Command
You clicked a link that corresponds to this MATLAB command:
Run the command by entering it in the MATLAB Command Window. Web browsers do not support MATLAB commands.

Select a Web Site
Choose a web site to get translated content where available and see local events and offers. Based on your location, we recommend that you select: .
You can also select a web site from the following list
How to Get Best Site Performance
Select the China site (in Chinese or English) for best site performance. Other bat365 country sites are not optimized for visits from your location.
Americas
- América Latina (Español)
- Canada (English)
- United States (English)
Europe
- Belgium (English)
- Denmark (English)
- Deutschland (Deutsch)
- España (Español)
- Finland (English)
- France (Français)
- Ireland (English)
- Italia (Italiano)
- Luxembourg (English)
- Netherlands (English)
- Norway (English)
- Österreich (Deutsch)
- Portugal (English)
- Sweden (English)
- Switzerland
- United Kingdom (English)
Asia Pacific
- Australia (English)
- India (English)
- New Zealand (English)
- 中国
- 日本Japanese (日本語)
- 한국Korean (한국어)