2-D and 3-D Plots
Plot continuous, discrete, surface, and volume data
Use plots to visualize data. For example, you can compare sets of data, track changes in data over time, or show data distribution. Create plots programmatically using graphics functions or interactively using the Plots tab at the top of the MATLAB® desktop.
For illustrations of some of the types of plots you can create programmatically, see Types of MATLAB Plots.
Categories
- Line Plots
Line plots, log plots, and function plots
- Data Distribution Plots
Histograms, pie charts, word clouds, and more
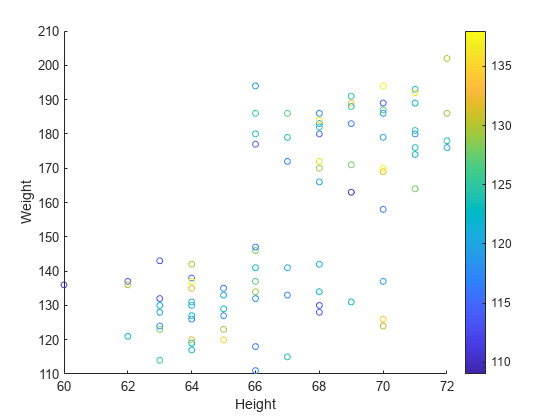
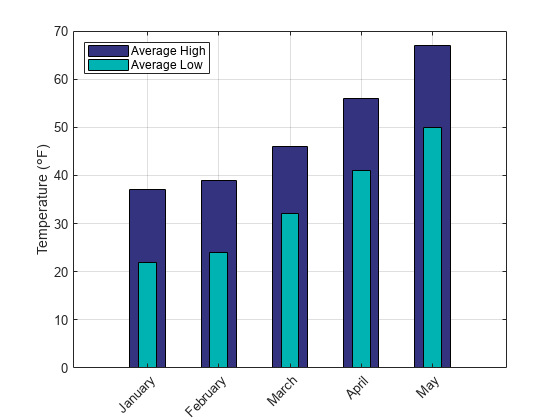
- Discrete Data Plots
Bar graphs, scatter plots, and more
- Geographic Plots
Visualize data on maps
- Polar Plots
Plots in polar coordinates
- Contour Plots
2-D and 3-D isoline plots
- Vector Fields
Quiver, compass, feather, and stream plots
- Surfaces, Volumes, and Polygons
Gridded surface and volume data, ungridded polygon data
- Animation
Animating plots


