Main Content

SIL/PIL Manager

Verify generated code

Since R2019b

Description

The SIL/PIL Manager simplifies verification of code that you generate from a model.

You can:

  • With one click, test numeric equivalence between the model and generated code by running back-to-back model simulations and software-in-the-loop (SIL) or processor-in-the-loop (PIL) simulations.

  • Configure SIL or PIL simulations to produce code coverage, execution-time, and stack usage metrics.

  • Enable your debugger for SIL simulations.

  • Export automatically generated test cases for Simulink® Test™.

SIL/PIL Manager app

Open the SIL/PIL Manager App

On the Simulink toolstrip Apps tab, click SIL/PIL Manager. Or, on the Embedded Coder app C Code tab, click Verify Code > SIL/PIL Manager.

Examples

expand all

  1. In the Command Window, enter:

    openExample('ecoder/SILPILVerificationExample', ...
                 supportingFile='SILTopModel.slx')
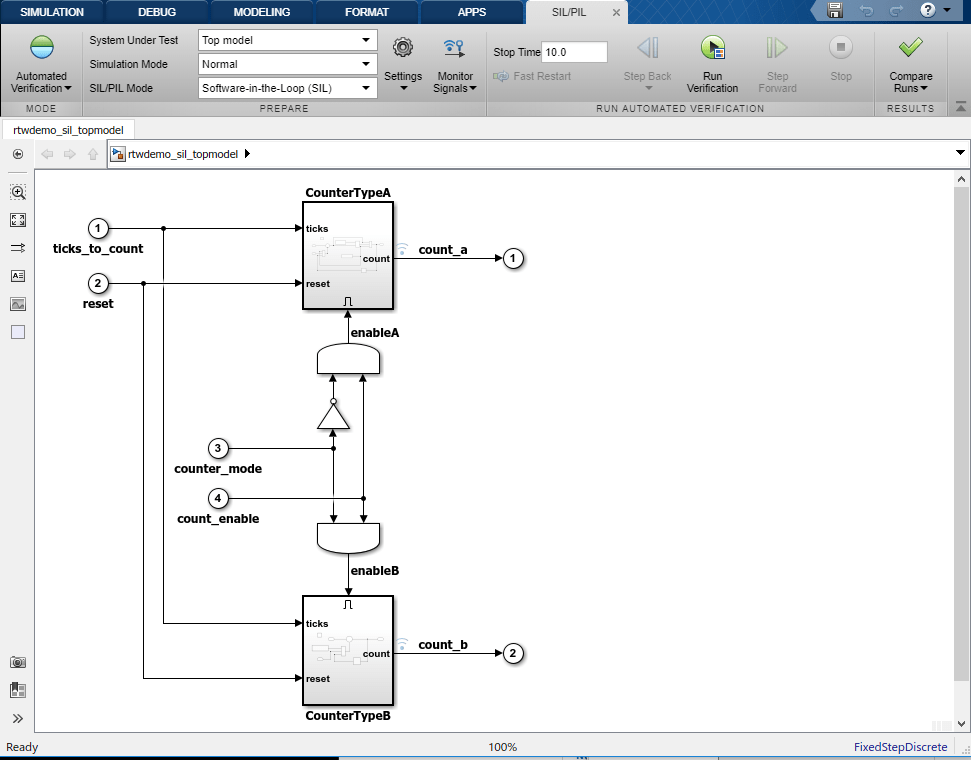
    The model opens in the Simulink Editor, with the SIL/PIL tab displayed.

  2. SIL and PIL simulations do not support both code execution time profiling and code coverage analysis. For this example, disable code coverage:

    1. In the Prepare section, click Settings.

    2. Under Coverage, click the Coverage Collection button off.

  3. In the Run Automated Verification section, click Run Verification.

    The SIL/PIL Manager runs these simulations back-to-back:

    • SILTopModel in normal mode

    • SILTopModel in SIL mode. As the Time Profiling controls are enabled, the SIL simulation also performs code execution profiling.

    You can monitor simulation progress through the Diagnostic Viewer.

    At the end of the second simulation:

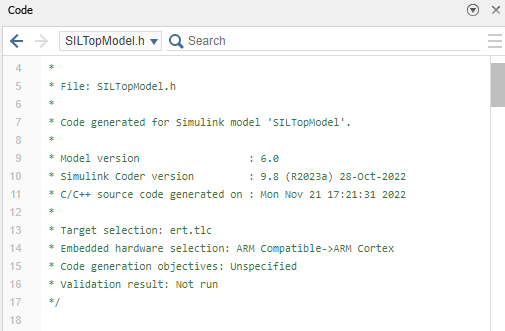
    • The SIL/PIL Manager displays generated code in the Code view, which enables you to analyze generated code, see code metrics, and trace between model elements and generated code.

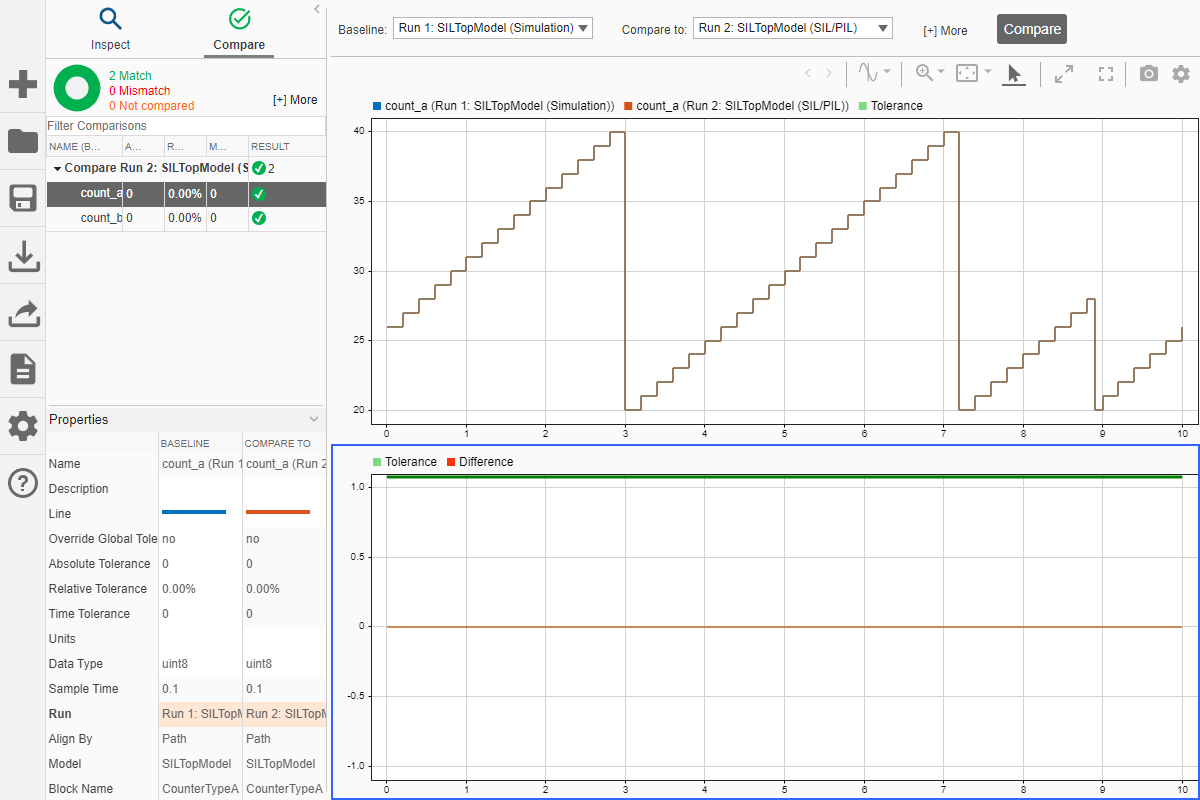
    • The Simulation Data Inspector compares results from the model against results from generated code.

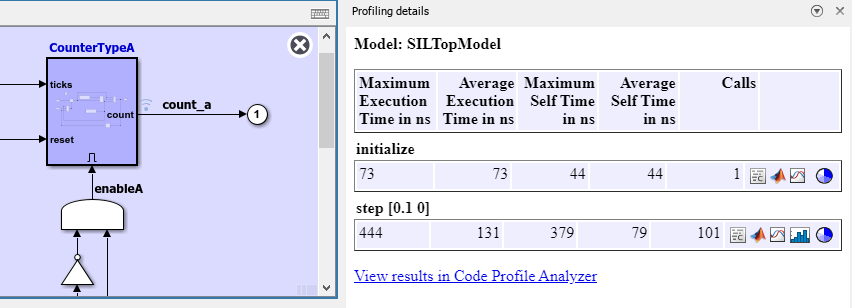
    • To view execution-time metrics, in the model view, click the blue region.

      To view the results in detail, open the Code Profile Analyzer by clicking the link.

  1. In the Command Window, enter:

    openExample('ecoder/SILPILVerificationExample', ...
                 supportingFile='SILTopModel.slx')
    The model opens in the Simulink Editor, with the SIL/PIL tab displayed.

  2. For this example, disable code execution time profiling and code coverage:

    1. In the Prepare section, click Settings.

    2. Under Time Profiling, click the Task Profiling button and the Functions button off.

    3. Under Coverage, click the Coverage Collection button off.

  3. At the end of the second simulation:

    • Check that the results from the model and generated code are numerically equivalent. In the Results gallery, under Numerical Equivalence Results, click Compare Runs or Data Inspector.

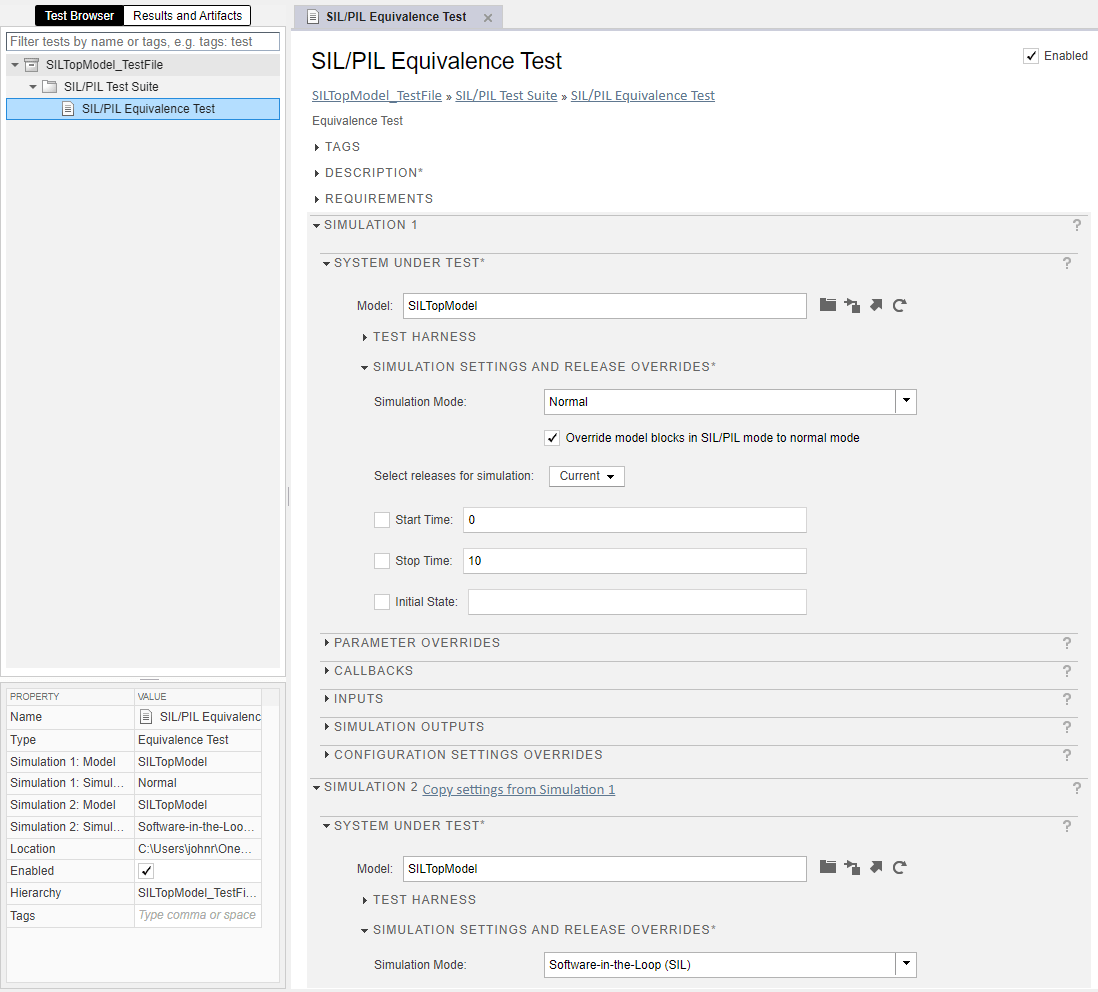
    • Export a test case for Simulink Test. Under Simulink Test, click Export to Test Manager. Then, in the Export SIL/PIL Test Cases dialog box, use the default settings, and click OK.

      The SIL/PIL Manager:

      • Creates the test case in SILTopModel_TestFile.mldatx, which you can find in the current working folder.

      • Opens the test file that contains the test case.

        For information about running test cases in Simulink Test, see Import Test Cases for Equivalence Testing (Simulink Test).

  1. In the Command Window, enter:

    openExample('ecoder/SILPILVerificationExample', ...
                 supportingFile='SILTopModel.slx')
    The model opens in the Simulink Editor, with the SIL/PIL tab displayed.

  2. In the Mode section, select SIL/PIL Simulation Only.

  3. In the Prepare section, open the Settings gallery:

    1. Under Time Profiling, click the Task Profiling button and Functions button off.

    2. Under Coverage, click the Coverage Collection button off.

    3. Under Stack Profiling, click the Stack Profiling button on.

  4. In the Run section, click Run SIL/PIL.

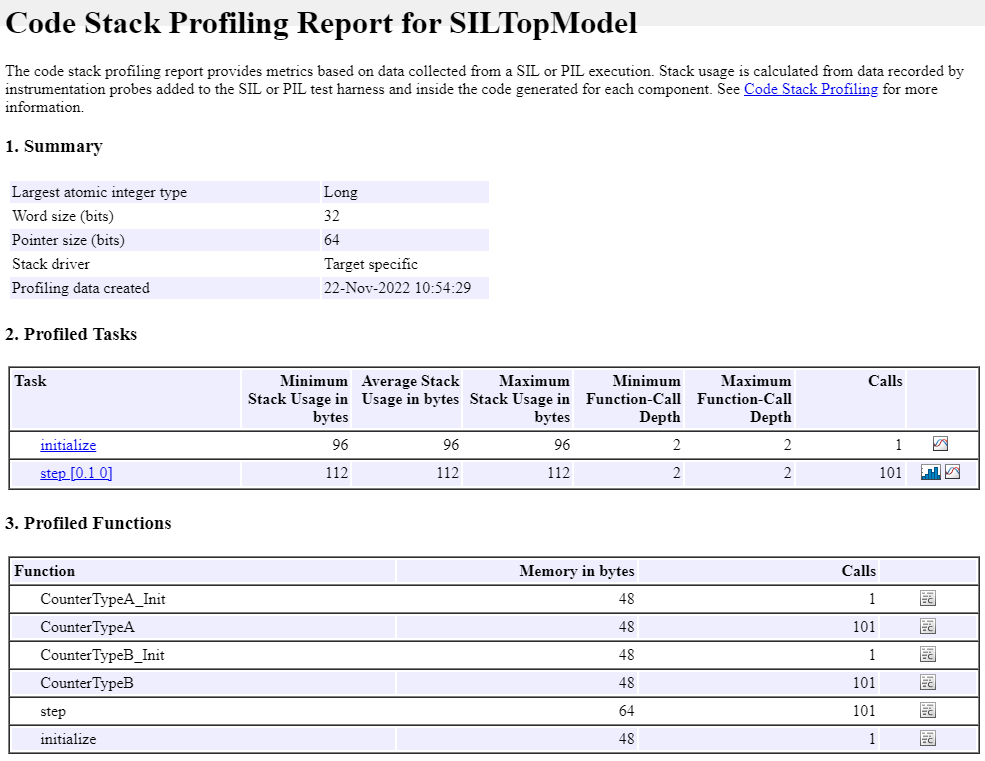
    The SIL simulation streams stack usage data to the Simulation Data Inspector. When the simulation is complete, the SIL/PIL Manager opens a code stack profiling report for the model.

  5. To examine the results in detail, use the Code Profile Analyzer. In the Results gallery, under Stack Profiling Results, click the Code Profile Analyzer button.

Related Examples

Version History

Introduced in R2019b