visualize
Description
visualize( plots the octave spectrum
computed by the o)octaveSpectrumEstimator
System object™. The visualization is updated with the computed spectrum as the simulation
progresses.
Examples
Measure Octave Spectrum of Streaming Audio
Create a dsp.AudioFileReader to stream an audio file for processing. Create an audioDeviceWriter to play the audio as you stream it.
reader = dsp.AudioFileReader("FunkyDrums-44p1-stereo-25secs.mp3");
player = audioDeviceWriter(SampleRate=reader.SampleRate);
Create an octaveSpectrumEstimator object with the same sample rate as the file reader.
o = octaveSpectrumEstimator(reader.SampleRate)
o =
  octaveSpectrumEstimator with properties:

            SampleRate: 44100
             Bandwidth: '1/3 octave'
    FrequencyWeighting: 'A-weighting'
         TimeWeighting: 'fast'
        FrequencyRange: [22 22050]
           FilterOrder: 2
    ReferenceFrequency: 1000
       OctaveRatioBase: 10
              ApplyLog: false
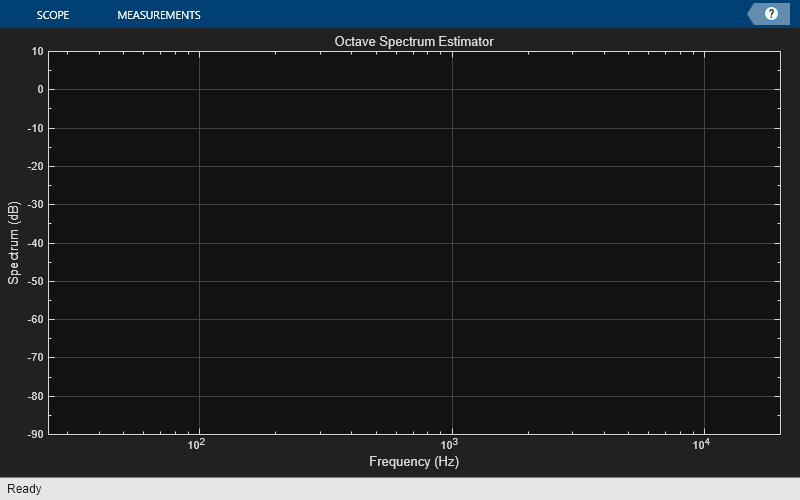
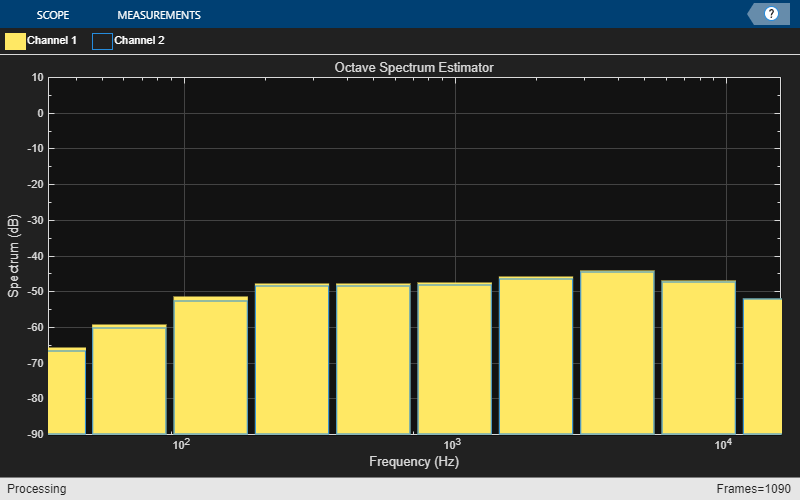
Call visualize on the object to open a visualizer to display the spectrum.
visualize(o)
In a streaming loop:
Read in a frame of audio data.
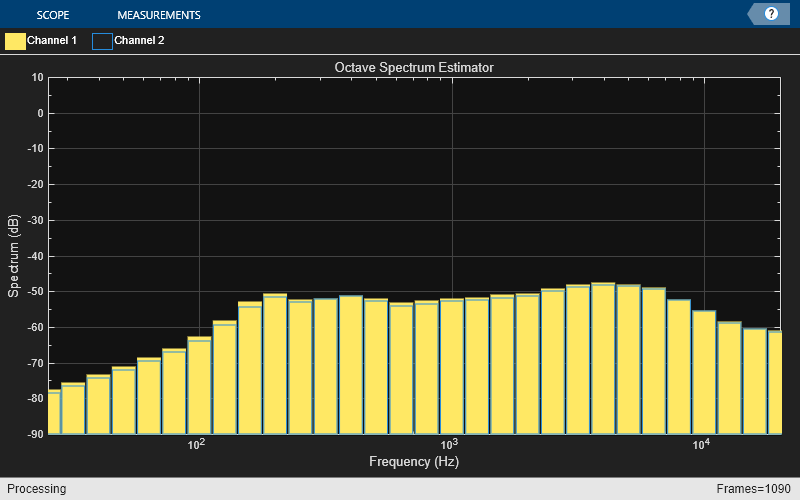
Compute the octave-band spectrum
Play the audio with the device writer.
See the visualizer update with the measured spectrum as the audio plays.
while ~isDone(reader)
    audioIn = reader();
    p = o(audioIn);
    player(audioIn);
end
Tune Octave Spectrum Estimator Properties
Create a dsp.AudioFileReader to stream an audio file for processing. Create an audioDeviceWriter to play the audio as you stream it.
reader = dsp.AudioFileReader("FunkyDrums-44p1-stereo-25secs.mp3");
player = audioDeviceWriter(SampleRate=reader.SampleRate);
Create an octaveSpectrumEstimator object with the same sample rate as the file reader and set the Bandwidth to 1 octave.
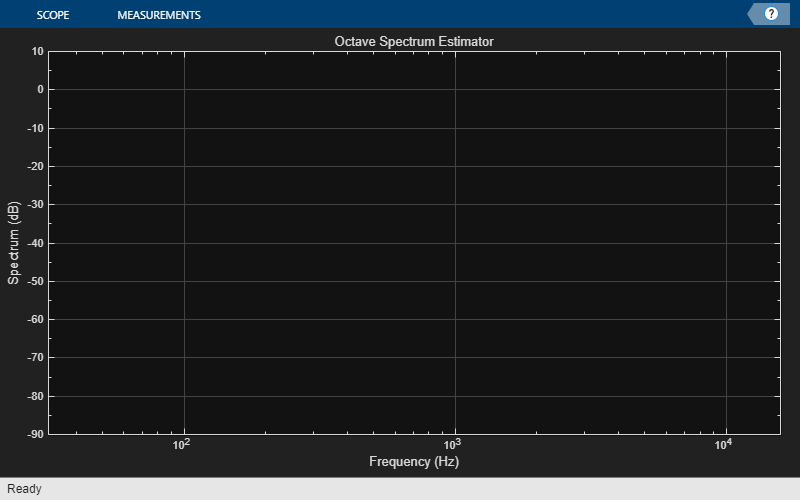
o = octaveSpectrumEstimator(reader.SampleRate,Bandwidth="1 octave");Call visualize on the object to open a visualizer to display the spectrum.
visualize(o)
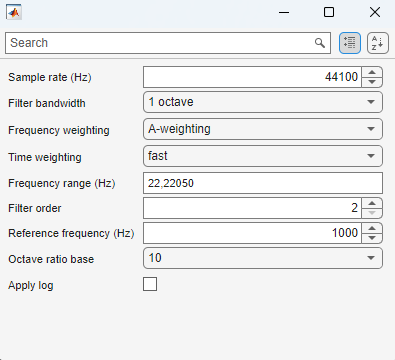
Call parameterTuner to open a UI to tune parameters of the octaveSpectrumEstimator while streaming.
parameterTuner(o)
In a streaming loop:
Read in a frame of audio data.
Compute the octave-band spectrum
Play the audio with the device writer.
Adjust the properties in the parameterTuner UI while streaming.
while ~isDone(reader)
    audioIn = reader();
    p = o(audioIn);
    player(audioIn);
end
Input Arguments
o — Octave spectrum estimator object
octaveSpectrumEstimator object
Octave spectrum estimator to visualize, specified as an octaveSpectrumEstimator
System object.
Output Arguments
h — Handle to visualizer
audio.ui.scope.OctaveSpectrumVisualizer object
Handle to the octave spectrum visualizer, returned as an
audio.ui.scope.OctaveSpectrumVisualizer object.
More About
Tuning Properties
Changing the Bandwidth, FrequencyRange, ReferenceFrequency, or OctaveRatioBase properties on the octaveSpectrumEstimator
object results in a change of the number of octave bands displayed in the visualizer. In
this case, the object resets the scope before continuing to display the spectrum.
Version History
Introduced in R2024b
See Also
MATLAB Command
You clicked a link that corresponds to this MATLAB command:
Run the command by entering it in the MATLAB Command Window. Web browsers do not support MATLAB commands.

Select a Web Site
Choose a web site to get translated content where available and see local events and offers. Based on your location, we recommend that you select: .
You can also select a web site from the following list
How to Get Best Site Performance
Select the China site (in Chinese or English) for best site performance. Other bat365 country sites are not optimized for visits from your location.
Americas
- América Latina (Español)
- Canada (English)
- United States (English)
Europe
- Belgium (English)
- Denmark (English)
- Deutschland (Deutsch)
- España (Español)
- Finland (English)
- France (Français)
- Ireland (English)
- Italia (Italiano)
- Luxembourg (English)
- Netherlands (English)
- Norway (English)
- Österreich (Deutsch)
- Portugal (English)
- Sweden (English)
- Switzerland
- United Kingdom (English)
Asia Pacific
- Australia (English)
- India (English)
- New Zealand (English)
- 中国
- 日本Japanese (日本語)
- 한국Korean (한국어)